Technical signal of VN-Index
In the morning trading session on February 20, 2024, VN-Index slightly increased while appearing a candlestick pattern similar to High Wave Candle accompanied by volume with no clear improvement in the morning session. This reflected the tug-of-war state of the index that had appeared.
Currently, the Stochastic Oscillator has advanced deep into the overbought zone and the possibility of a sell signal will appear in the next few sessions. If this happens, it indicates that the short-term adjustment risk will increase.
Technical signal of HNX-Index
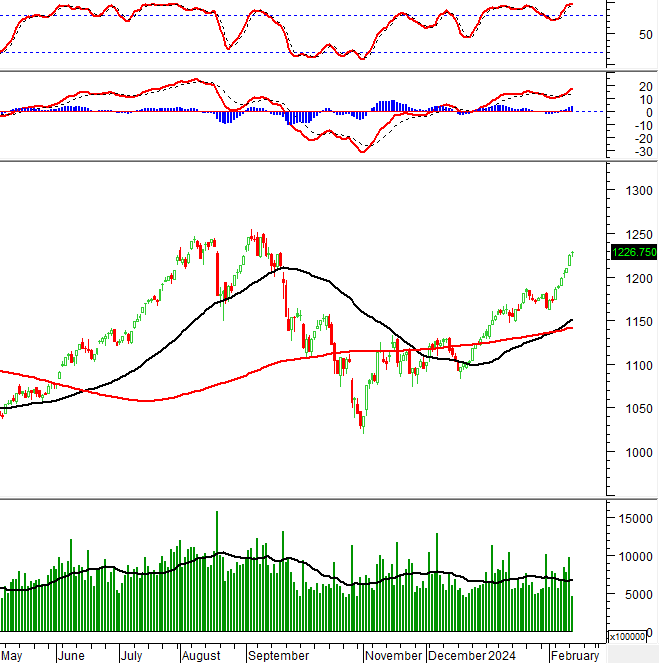
In the trading session on February 20, 2024, HNX-Index slightly increased while the trading volume was at a high level and is expected to exceed the 20-day moving average at the end of the session.
The MACD indicator continues to rise after giving a buy signal, indicating that the short-term outlook is not too pessimistic.

FTS – FPT Securities Joint Stock Company
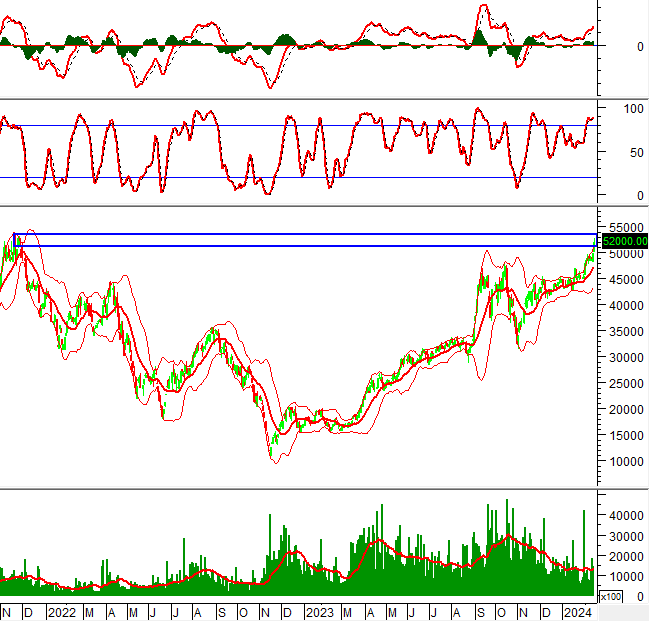
In the morning session on February 20, 2024, the stock FTS rebounded and set a new 52-week high, accompanied by a Rising Window candlestick pattern and volume exceeding the 20-session moving average in the morning session, which showed a very optimistic sentiment of investors.
In addition, the MACD indicator continues to rise after giving a buy signal, so the positive outlook in the long term still exists.
However, the stock FTS is testing the previous peak of November 2021 (equivalent to the range of 51,000-53,500) in the context of the Stochastic Oscillator being in the overbought zone. If sell signals reappear and the indicators fall out of this zone in the upcoming sessions, the short-term correction risk will increase.
VRE – Vincom Retail Joint Stock Company
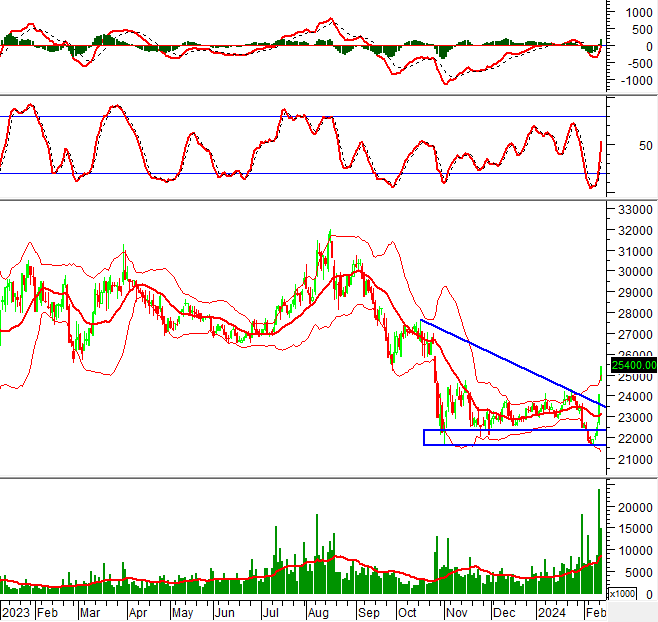
In the morning trading session on February 20, 2024, the stock VRE strongly increased while a Three White Soldiers candlestick pattern appeared, accompanied by continuous volume exceeding the 20-session moving average in recent sessions, indicating that investors have returned to active trading.
In addition, the MACD and Stochastic Oscillator are heading up after a sell signal appeared, so the recovery trend continues to be strengthened.
The price of VRE has now broken above the upper edge of the Descending Triangle pattern. If the upward momentum continues to be maintained, the potential price target is the range of 29,000-29,700.
Technical Analysis Department, Vietstock Advisory Office


