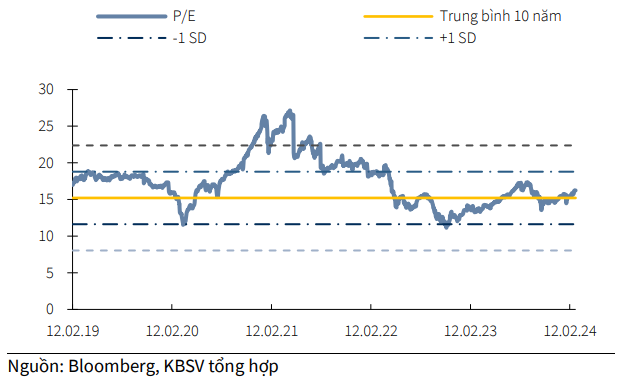
In terms of valuation, according to Bloomberg data, the current P/E ratio of the VN-Index is about 16.2 times. KBSV observes that this valuation level is approaching the high range within the average of the past 2 years, but it is not significantly higher than the 10-year average of the VN-Index.
|
P/E of the VN-Index during 2010-2024
|
Based on expectations of economic recovery throughout 2024 and the low interest rate environment, analysts believe that the market valuation is still appropriate for long-term investors to accumulate stocks. However, they also note that opportunities for attractive profit margins will decrease as more stocks approach high valuation levels.
In March, the VN-Index is expected to trade at higher levels with sustained recovery, but it is not anticipated to have a strong breakthrough like the first two months of the year, and there’s an increasing risk of short-term corrections.
Moreover, analysts expect that the low interest rate environment and expectations of business performance recovery in 2024 will drive the stock market. “We maintain the view that business results will differentiate across industries and stock prices will react accordingly,” KBSV analyzed.
On the other hand, investor sentiment is still supported by positive trends in major markets worldwide. For example, the US stock market is still moving positively at historical highs, while Asian markets such as China and Korea continue their recovery.
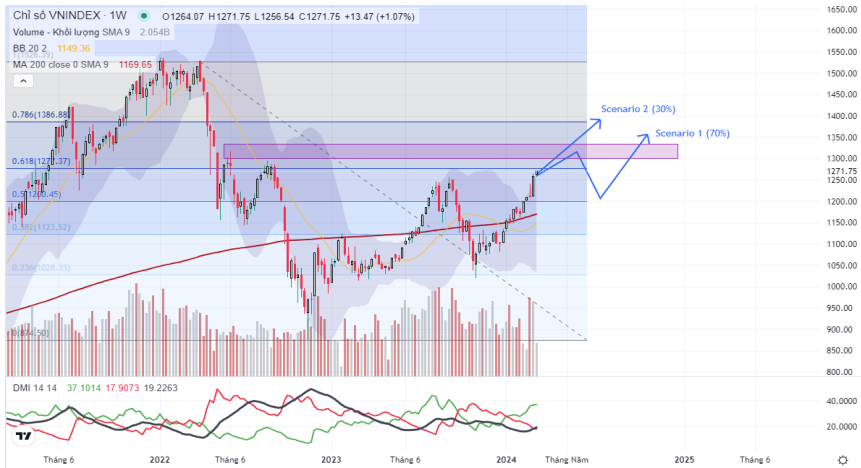
From a technical perspective, KBSV Securities believes that the VN-Index is likely to continue its momentum in the short term before facing significant correction pressure around the 1,300-1,350 point range.
|
Technical analysis chart of the VN-Index
Source: KBSV
|
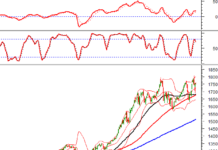
On the daily chart, the VN-Index is maintaining a short-term upward trend with higher highs and lows. The increasing liquidity with a trading value of over 20 trillion VND per session helps strengthen the upward trend and witness convincing recovery sessions following technical corrections.
In addition, the ADX indicator has surged from the 24 level at the beginning of February to around 41 at the end of the month, indicating the strength of the trend and the likelihood of maintaining an upward momentum in the short term.
However, on the weekly and monthly time frames, the risks become more evident as the index approaches a significant resistance zone corresponding to the peak of the short-term rally in August 2022. Meanwhile, the ADX indicator on both time frames remains below 25 during the recovery phase since the October 2023 bottom.
Therefore, KBSV believes that the VN-Index will face significant volatility pressure around the resistance zone of 1,300-1,350 points. Analysts emphasize that this is also a notable level to confirm whether the market has returned to an upward trend in the medium term or not. The trading volume will be a key indicator to monitor during breakout rallies after the index reaches the resistance level.
Lastly, the analysis team provides two scenarios.
In the first scenario (70% probability), if the index continues to rise to a higher peak with decreasing trading volume, the VN-Index will enter a sharp correction phase afterward, with support around the 1,220 (+/-10) point range and a deeper level at 1,170 (+/-10) points.
In the remaining scenario (30% probability), the VN-Index can maintain its upward momentum through the 1,300 – 1,350 point range. However, KBSV evaluates that the probability for this scenario is not high, as many leading sectors have already experienced medium-term breakthroughs and technical indicators are showing overbought signals.


