STOCK MARKET ANALYSIS WEEK 11-15/03/2024
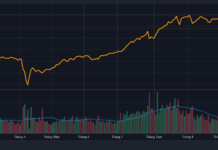
During the week (11-15/03/2024), the VN-Index rebounded after a previous week of decline, accompanied by the appearance of a High Wave Candlestick pattern, indicating that investors’ sentiment is still quite mixed.
In addition, the Stochastic Oscillator indicator has entered the overbought zone, suggesting a possibility of a sell signal in the near future. If this happens, the outlook for the index will become more negative.

TECHNICAL ANALYSIS
Trend and Price Oscillation Analysis
VN-Index – Forming a Doji candlestick pattern
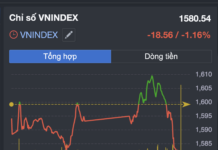
In the trading session on 15/03/2024, the VN-Index showed a consolidation phase and is forming a Doji candlestick pattern, accompanied by volume continuing to surpass the 20-day moving average, reflecting the indecisiveness of investors.
In addition, the MACD indicator has given a sell signal and is trending downwards, so the short-term prospects remain pessimistic.
However, the VN-Index is still being supported quite well by the Fibonacci Projection 161.8% level (equivalent to 1,245-1,265 points) as well as consistently staying above the Middle line of the Bollinger Bands in recent sessions, suggesting a positive long-term trend.

HNX-Index – High Wave Candlestick pattern appears
In the trading session on 15/03/2024, the HNX-Index slightly declined and a High Wave Candlestick pattern emerged, accompanied by irregular volume fluctuations in recent sessions, indicating the unstable sentiment of investors.
In addition, the MACD indicator has shown a buy signal, so the prospects in the near future will be more optimistic as it continues to trend upwards and remains above the 0 level.
Currently, the HNX-Index is moving within a Bullish Price Channel and retesting the previous peak in October 2023 (equivalent to the range of 236-240 points). If the index continues its upward trend and successfully breaks through this level, it will become a potential support zone in the future.

Money Flow Analysis
Smart money flow dynamics: The Negative Volume Index of the VN-Index has crossed above and is above the 20-day EMA. Therefore, the risk of sudden downward thrust will decrease.

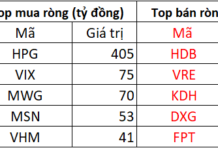
Foreign capital flow dynamics: Foreign investors continued to be net sellers in the trading session on 15/03/2024. If foreign investors maintain this action in the coming sessions, the situation will be more pessimistic.
Technical Analysis Department, Vietstock Advisory Department


