


The Vn-Index closed the 11th trading week of 2024 at 1,263.78 points, an increase of 16.43 points or 1.32% compared to the closing of the 10th week, with slightly lower liquidity from the record high in the previous week.
The average trading value per session (calculated across all 3 exchanges) in week 11 reached VND 28.368 trillion. Specifically for matched orders, the average trading value per session was VND 26.661 trillion, a decrease of -5% compared to the previous week, but still 19.8% higher than the 5-week average.
When analyzed by sector, the average trading value per session decreased mainly in the Banking, Real Estate, and Steel sectors. The price indices of these three sectors also decreased. Conversely, only the Agriculture & Seafood and Maritime sectors saw both price and liquidity increase.
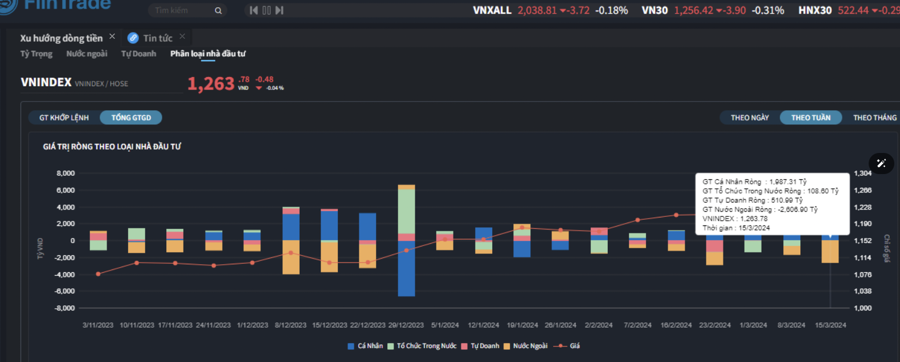
Foreign investors had a net sale of VND 2,606.9 billion, and specifically for matched orders, they had a net sale of VND 2,600.2 billion.
The main net purchases for foreign investors in matched orders were in the Financial Services and Personal & Household Goods sectors. The top net purchases for foreign investors included the following tickers: FTS, EIB, KDH, SSI, DIG, NLG, GVR, CTD, VHC, VGC.
The main net sales for foreign investors in matched orders were in the Food and Beverage sector. The top net sales for foreign investors included the following tickers: VNM, VHM, MWG, MSN, SBT, VPB, VCB, SAB, VND.
The trading value of matched orders by foreign investors in week 11 of 2024 reached nearly VND 21.5 trillion, which is the highest weekly trading scale by foreign investors to date.
Individual investors had a net purchase of VND 1,987.3 billion, of which they had a net purchase of VND 2,006.1 billion. Specifically for matched orders, they had a net purchase in 11 out of 18 sectors, mainly in the Food and Beverage sector. The top net purchases for individual investors included the following tickers: VHM, VNM, HSG, VPB, MWG, SBT, HPG, VND, DGC, MSN.
The net sales in matched orders for individual investors were in 7 out of 18 sectors, mainly in the Construction and Materials, and Financial Services sectors. The top net sales included the following tickers: EIB, FTS, SSI, PC1, GAS, KDH, DCM, ACB, PLX.
Domestic institutional investors had a net purchase of VND 108.6 billion, and specifically for matched orders, they had a net purchase of VND 290.1 billion.
Specifically for matched orders, domestic institutional investors had a net sale in 7 out of 18 sectors, with the highest value being in the Industrial Goods and Services group. The top net sales included the following tickers: HSG, VHM, VTP, VPB, HPG, HAH, PVD, NLG, CTR, TPB.
The largest net purchases were in the Food and Beverage sector. The top net purchases included the following tickers: MSN, PC1, DCM, NVL, SAB, GAS, VNM, ACB, NAB, VCB.
Proprietary traders had a net purchase of VND 511 billion, and specifically for matched orders, they had a net purchase of VND 304.1 billion. Specifically for matched orders, proprietary traders had a net purchase in 8 out of 18 sectors. The strongest net purchases were in the Banking and Basic Resources sectors. The top net purchases for proprietary traders in today’s session included the following tickers: PLX, HPG, FCN, GAS, VHM, VNM, STB, HDG, ACB, FUESSVFL.
The top net sales were in the Information Technology sector. The top stocks sold included the following tickers: FPT, MSN, KDH, DIG, PVT, FRT, VCI, PVP, PVD, FTS.
Cash flow trends: The allocation of funds increased in the Stock market, Food, Agriculture & Seafood, Retail, Chemicals, Oil & Gas, and Warehouse & Logistics sectors, while it decreased in the Real Estate, Banking, Construction, and Steel sectors.
Money flow strength: The share of trading value continued to decrease for large-cap VN30 stocks for the third consecutive week, while it continued to increase for mid-cap VNMID and small-cap VNSML stocks.
In week 11 of 2024, the share of trading value in the large-cap VN30 stocks decreased to 37.3% from 40.8% in the previous week. This is the lowest level in the past 4 weeks.
On the other hand, the share of trading value in the mid-cap VNMID stocks was 48.8%, the highest level in the past 13 weeks. As for the small-cap VNSML stocks, the share of trading value increased to 10.7% from 9% in the previous week.
In terms of money flow scale, the average trading value per session decreased by -14.6% (equivalent to -1,609 billion dong) for VN30 stocks and -1.8% (equivalent to -231 billion dong) for VNMID stocks. Meanwhile, the VNSML group continued to increase for the 4th consecutive week, at +11.9% (equivalent to +287 billion dong).
In terms of price volatility, VNSML recorded the highest increase (+3.41%), followed by VNMID (+2.26%) and small-cap VN30 (+0.5%).


