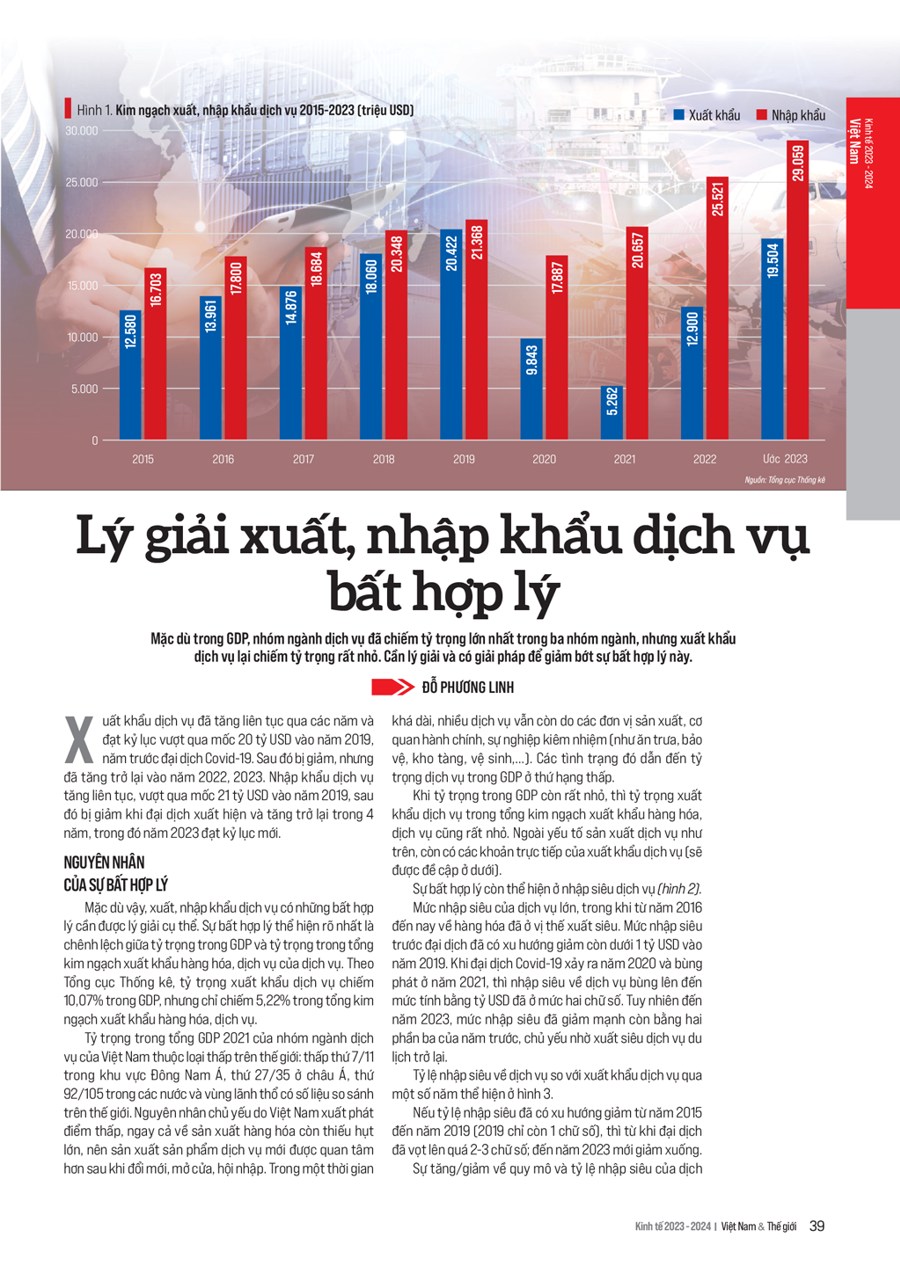
Service exports have been consistently rising over the years, reaching a record high of over $20 billion in 2019, before the Covid-19 pandemic. It experienced a dip but rebounded in 2022 and 2023. Service imports have also been on an upward trajectory, surpassing the $21 billion mark in 2019, before the pandemic caused a decline, and then picking back up over the next four years, with 2023 setting a new record.
REASONS FOR DISPARITIES
However, there are some disparities in service exports and imports that require further explanation. The most notable disparity is the difference between the proportion in GDP and the proportion in the total export turnover of goods and services. According to the General Statistics Office, service exports account for 10.07% of GDP but only 5.22% of the total export turnover of goods and services.
The proportion of Vietnam’s service sector in the total GDP in 2021 was relatively low compared to other countries: 7th lowest out of 11 countries in Southeast Asia, 27th out of 35 in Asia, and 92nd out of 105 countries and territories with comparable data worldwide. This is mainly due to Vietnam’s low starting point, even in terms of goods production, there were significant shortages, so the production of service products only gained more attention after renewal, openness, and integration. For a long time, many services were still provided by production units, administrative agencies, and non-business units (such as lunch, security, warehousing, and cleaning services). These situations led to a low ranking in terms of the proportion of services in GDP.
When the proportion in GDP is very small, the proportion of service exports in the total export turnover of goods and services is also minuscule. In addition to the above-mentioned service production factors, there are also direct components of service exports (which will be mentioned below).
The disparities are also evident in the service trade deficit (Figure 2).
The service trade deficit is significant, while goods trade has been in a surplus position since 2016. The deficit showed a decreasing trend before the pandemic, falling below $1 billion in 2019. When the Covid-19 pandemic occurred in 2020 and escalated in 2021, the service trade deficit surged to a double-digit billion-dollar figure. However, in 2023, the deficit decreased substantially to two-thirds of the previous year’s level, mainly due to a return to a surplus in tourism services.
The ratio of the service trade deficit to service exports in selected years is illustrated in Figure 3.
If the deficit ratio had been decreasing from 2015 to 2019 (reaching a single-digit percentage in 2019), it soared to a double-digit percentage during the pandemic years; only in 2023 did it show a significant decline.
The increase/decrease in the scale and ratio of the service trade deficit is attributed to various service items, including three notable ones: transport services, tourism services, and other services.
The proportion of export and import and the trade deficit of transport services in the total export and import and trade deficit of services in selected years are presented in Figure 4. Thus, transport services account for the largest proportion of the export, import, and trade deficit of services.
The fluctuations in the export and import of services, as well as the trade deficit, are mainly due to the weakness of Vietnam’s transport services. The intention to develop ocean transport over a decade ago failed due to waste and loss, and there has been a regression; meanwhile, rail transport is slow or even declining. The reality of Vietnam’s ocean transport can be observed through some data: by the end of 2021, Vietnam’s fleet consisted of 1,502 vessels, including 1,032 transport ships, and 470 other types of ships; the number of transport ships has decreased by 235 compared to the end of 2016; most of the 1,032 transport ships are small vessels (below 5,000 GT – small-sized – with 776 units, accounting for 75.5%; from 5,000 to 30,000 GT, there are slightly over 200 vessels, making up 20%; and above 30,000 GT, there are only 42 vessels, approximately 4.1%).
The majority of these vessels are used for general cargo and bulk cargo transportation, with only a small portion dedicated to container, oil, chemical, and liquefied gas shipping, as well as passenger transportation. There are over 500 shipowners, ship management and operation companies, and 38 foreign container lines operating in Vietnam, including all the largest companies in terms of international market share. Vietnam has 10 container shipping lines primarily serving the domestic market. The volume of cargo handled by ports is projected to reach 1,140-1,423 million tons by 2030, of which 455-559 million tons will be containers. Unfortunately, Vinashin has gone bankrupt.
With such ocean transport capacity, the market share for transporting exported and imported goods mostly goes to foreign companies, resulting in an inevitable trade deficit in transport services.
TOURISM SERVICES RETURN TO SURPLUS
Tourism services are one of the most significant components of the total export and import turnover and the trade surplus and deficit of services. The export and import, as well as the trade surplus and deficit of tourism services in selected years, are depicted in Figure 5.
2019 was a record-breaking year for tourism services, with the highest levels of both export and import, as well as a substantial trade surplus. However, the sector experienced a trade deficit for three consecutive years from 2020 to 2022 (with deficits of $803 million, $3,681 million, and $2,699 million, respectively). In 2023, tourism services returned to a trade surplus due to a 138.4% increase in exports, while imports only rose by 19.6%, resulting in a considerable trade surplus in tourism services. This outcome is attributed to the accelerated growth of international arrivals in Vietnam, following the country’s successful containment of the Covid-19 pandemic, coupled with strategic shifts in pandemic prevention and control measures regarding entry and exit in countries like China.
This article was published in the special edition of Kinh te 2023-2024: Vietnam & The World on March 6, 2024. To read the full edition, please visit: https://postenp.phaha.vn/chi-tiet-toa-soan/tap-chi-kinh-te-viet-nam


