2 sessions
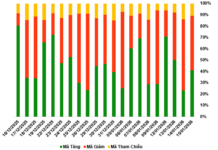
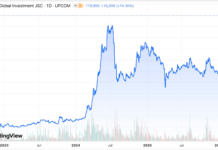
The chart above illustrates market trends over two sessions, offering a visual representation of data for analysis.
Three Sessions:
3 sessions
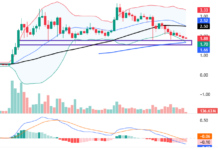
The following chart displays three sessions’ worth of market data, providing a detailed insight into short-term trends and fluctuations.
Four Sessions:
4 sessions
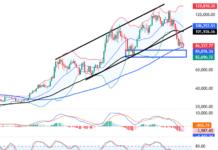
This section presents a chart summarizing market performance across four sessions, enabling investors and analysts to identify patterns and make informed decisions.
Five Sessions:
5 sessions
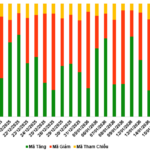
The data presented in this chart spans five sessions, offering a broader perspective on market movements and trends over a slightly longer period.
High-Volume Trading:
High-volume trading
The chart below depicts trading activity with a focus on high-volume transactions, allowing investors to identify potential opportunities or risks associated with increased trading activity.
Today’s Market Outlook (October 29, 2024):
The Must-Watch Stocks for October 15th’s Opening Bell
The following is a list of the top-performing and worst-performing stock codes from recent sessions, according to statistics from Vietstock.
The Golden Age of Industrial Real Estate: 2025 and Beyond
On September 19, 2024, VNIC successfully hosted the “National Industrial Real Estate Forum 2024”. At this event, leading industry experts predicted a robust boom in Vietnam’s industrial real estate market in 2025.

