Technical Signals of VN-Index
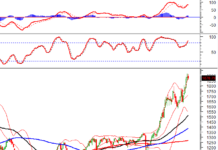
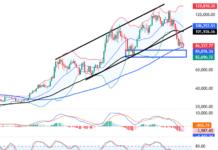
In the trading session on the morning of 11/11/2024, the VN-Index continued its sharp decline and formed a Three Black Crows candlestick pattern, indicating a deteriorating short-term outlook.
Currently, the VN-Index is witnessing a significant drop, accompanied by a notable surge in trading volume during the morning session, reflecting the pessimistic sentiment among investors.
At the moment, the VN-Index has pulled back to retest the Fibonacci Projection 23.6% level (corresponding to the 1,225-1,240 point region) while the MACD indicator continues to widen its gap with the Signal line after previously triggering a sell signal. If this dynamic persists and the index breaks below this support level, the downside risk will heighten in the upcoming sessions.

Technical Signals of HNX-Index
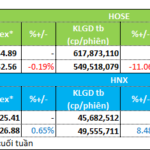
During the trading session on 11/11/2024, the HNX-Index witnessed a slight decline and formed a Doji candlestick pattern, reflecting investor indecision.
Presently, the index is testing the Middle line of the Bollinger Bands, while the Stochastic Oscillator indicator maintains an upward trajectory after generating a buy signal earlier. Should the index successfully surpass this Middle line, a recovery scenario could unfold in the forthcoming sessions.

CMG – CMC Technology Group Joint Stock Company
In the morning session of 11/11/2024, CMG witnessed a strong surge and formed a White Marubozu candlestick pattern, accompanied by above-average trading volume, indicating active participation from investors.
Additionally, the stock price continues to closely follow the upper band (Upper Band) of the Bollinger Bands, while the MACD indicator widens its gap with the Signal line after providing an earlier buy signal, further reinforcing the prevailing uptrend.
Moreover, the stock price has crossed above the 100-day SMA, suggesting the emergence of a positive mid-term outlook.

STB – Sài Gòn Thương Tín Commercial Joint Stock Bank
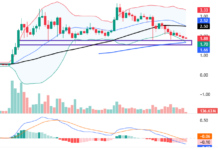
During the morning session of 11/11/2024, STB experienced a sharp decline and formed a Black Marubozu candlestick pattern, accompanied by a significant increase in trading volume, which is expected to surpass the 20-day average by the session’s end, reflecting investor pessimism.
Additionally, the stock price has dropped below the Middle line of the Bollinger Bands, indicating a less optimistic short-term outlook.
Furthermore, the stock price is trending towards retesting the September 2023 high region (corresponding to 33,000-33,500) while the Stochastic Oscillator indicator triggers a sell signal. Should the stock price continue to decline and breach this support region, the downside risk will elevate in the upcoming sessions.

Technical Analysis Team, Vietstock Consulting
SSI Research: Short-term Volatility Presents Buying Opportunities for Long-term Investors
“According to SSI Securities Corporation’s November 2024 strategy report, the SSI Research Center for Analysis and Investment Consulting believes that the market may fluctuate in the short term. However, this also presents an opportunity to buy potential stocks at reasonable prices to build a long-term investment portfolio.”
The Looming Threat of a Market Downturn: Navigating the Risks Ahead
The VN-Index witnessed its fourth consecutive session of losses, dipping below the 200-day SMA. This downward trend indicates a negative shift in market sentiment. Accompanying this decline is a drop in trading volume below the 20-day average, reflecting heightened investor caution. The MACD indicator continues to plummet, reinforcing the sell signal and suggesting that the short-term outlook remains pessimistic.

