Technical Signals for VN-Index
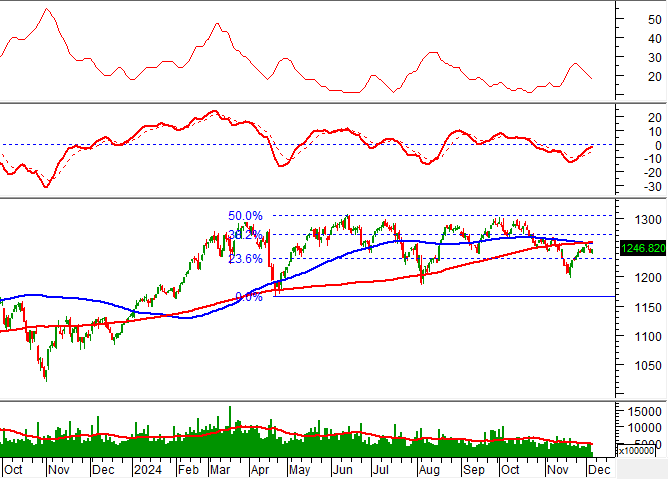
In the trading session on the morning of December 5, 2024, the VN-Index gained points, but trading volume remained lackluster, indicating investors’ hesitation.
Currently, the VN-Index is retesting the Fibonacci Projection 23.6% threshold (equivalent to the 1,225-1,240 point region) while the ADX indicator remains low and weakens. This suggests that the back-and-forth trend with alternating gains and losses may continue in upcoming sessions.
Technical Signals for HNX-Index
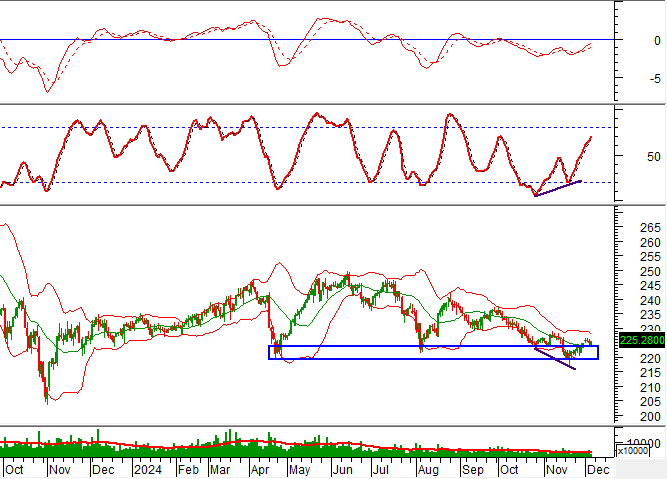
On December 5, 2024, the HNX-Index rose and retested the Middle line of the Bollinger Bands, while liquidity fluctuated erratically, reflecting investors’ unstable psychology in recent sessions.
At present, the Stochastic Oscillator indicator continues to climb after a Bullish Divergence and gives a buy signal while the index retests the old bottom of April 2024 (equivalent to the 220-225 point region). If there is an improvement in cash flow in the next sessions, the outlook will be more optimistic.
NTP – Plastic Juvenile Pioneer JSC
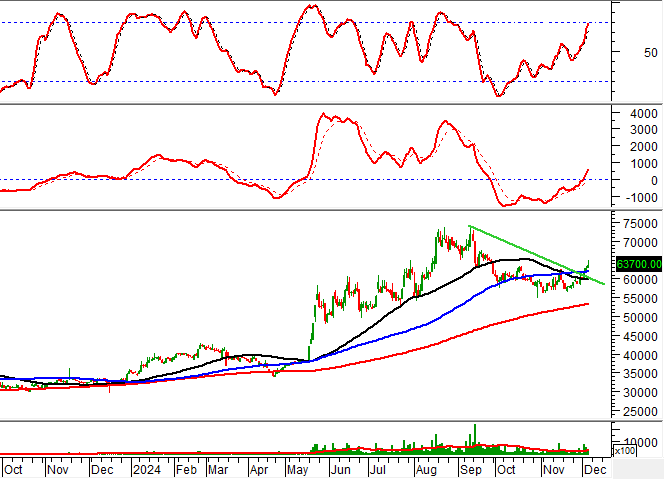
In the morning session of December 5, 2024, NTP rose in price and formed a Three White Soldiers candlestick pattern, with trading volume exceeding the 20-session average, indicating investors’ optimism.
Currently, the stock price continues to rise after breaking out of the short-term downward trendline, while the Stochastic Oscillator indicator maintains its previous buy signal, further reinforcing the strength of the stock’s current recovery.
VND – VNDIRECT Securities Corporation
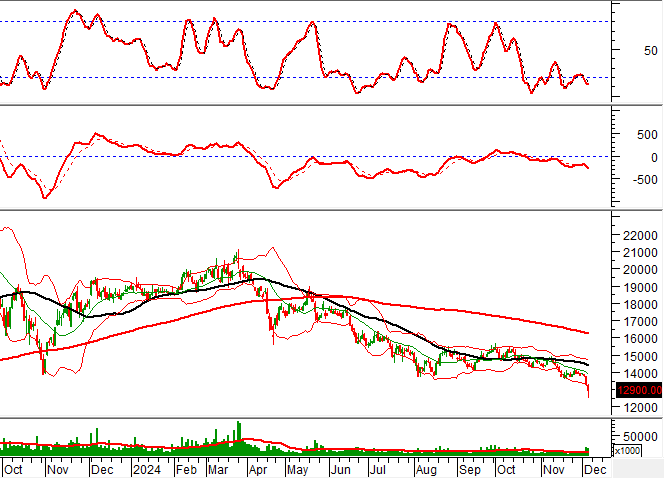
On the morning of December 5, 2024, VND fell in price as trading volume surged in the morning session, exceeding the 20-session average and indicating investors’ pessimism.
At present, the stock price continues to hug the lower band (Lower Band) of the Bollinger Bands. The MACD indicator is steadily widening the gap with the signal line after previously giving a sell signal. This suggests that the short-term downward trend is likely to persist in the coming sessions.
Moreover, with the stock price trading below the SMA 50-day and SMA 200-day moving averages, the mid- and long-term prospects appear less optimistic.
Technical Analysis Department, Vietstock Consulting


