Technical Signals of VN-Index
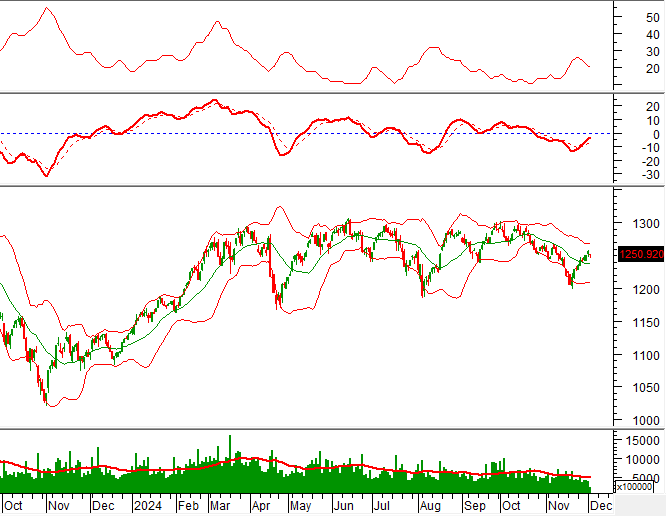
In the trading session on the morning of December 3, 2024, the VN-Index declined, and a Doji candlestick pattern emerged, with a slight increase in trading volume. This indicates that investors are hesitant and cautious in their trading decisions.
Currently, the index remains above the Middle Bollinger Band, and the MACD and Stochastic Oscillator indicators continue to trend upward, providing a buy signal. These technical factors suggest a relatively optimistic short-term outlook.
Technical Signals of HNX-Index
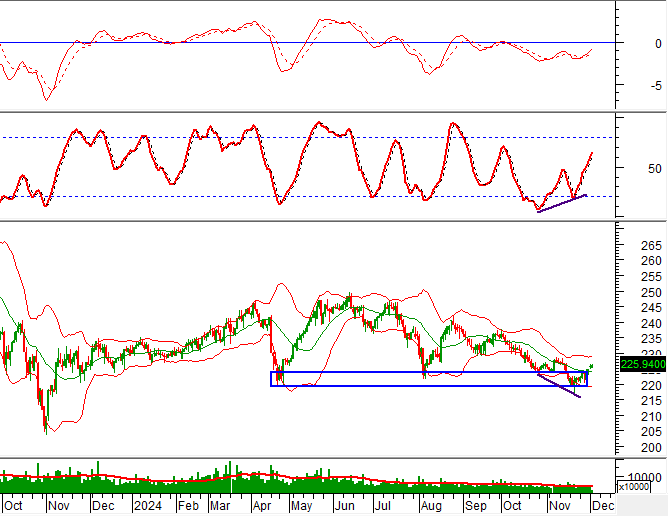
On December 3, 2024, the HNX-Index increased and retested the Middle Bollinger Band. The trading volume has been erratic, indicating unstable investor sentiment in recent sessions.
The Stochastic Oscillator indicator is trending upward, exhibiting a Bullish Divergence, and generating a buy signal. The index is retesting the old low of April 2024 (corresponding to the 220-225-point region). If there is an improvement in money flow in the upcoming sessions, the outlook will become more positive.
CSV – Southern Basic Chemicals JSC
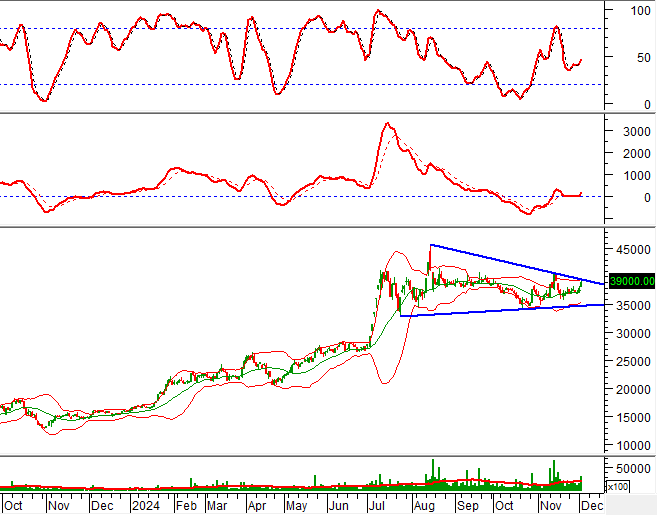
On the morning of December 3, 2024, CSV witnessed a surge in price, accompanied by a trading volume that surpassed the 20-session average. This reflects the optimistic sentiment among investors.
Currently, the stock price is rebounding after successfully testing the Middle Bollinger Band, and the MACD indicator is providing a buy signal again, reinforcing the short-term upward trend.
Moreover, the stock price is retesting the upper edge of the Triangle pattern. In a positive scenario, if the stock price breaks out above this upper edge, the potential price target for the pattern is expected to be in the range of 50,000-53,000.
VCB – Vietnam Joint Stock Commercial Bank for Industry and Trade
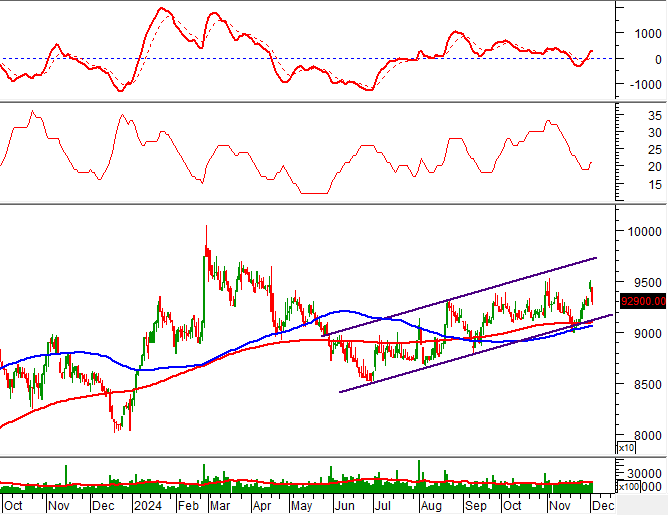
During the morning session of December 3, 2024, VCB witnessed a decline in its stock price, accompanied by a significant increase in trading volume, which is expected to surpass the 20-day average by the end of the session. This indicates a pessimistic sentiment among investors.
Currently, the stock price has failed to test the upper edge of the Bullish Price Channel, and the ADX indicator is fluctuating in the gray area (20
Technical Analysis Department, Vietstock Consulting


