


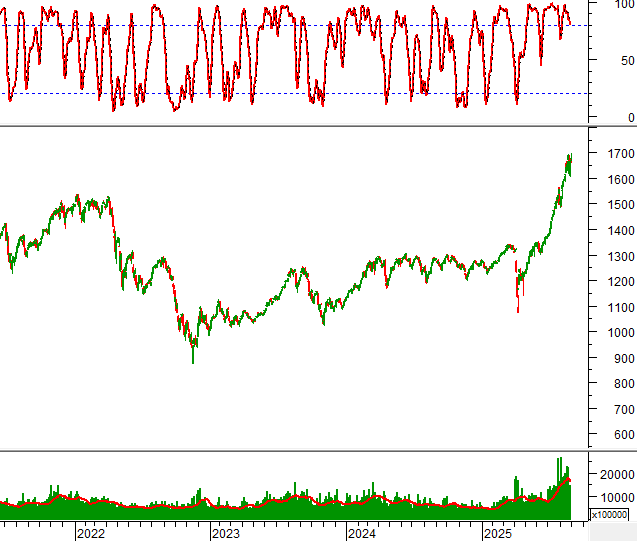
Technical Signals for the VN-Index
During the trading session on the morning of August 28, 2025, the VN-Index experienced intense tug-of-war movements. This was an anticipated development following the previous appearance of a Long Upper Shadow candlestick pattern. A positive takeaway is that there was no sign of pessimism or panic in the market. Buying pressure quickly emerged as the broader market underwent a correction.
The old peak region of 1,680-1,693 points will continue to act as the key resistance level for the index in the near term.
Given the low liquidity environment, a scenario of the VN-Index moving sideways in the coming period is likely to unfold.
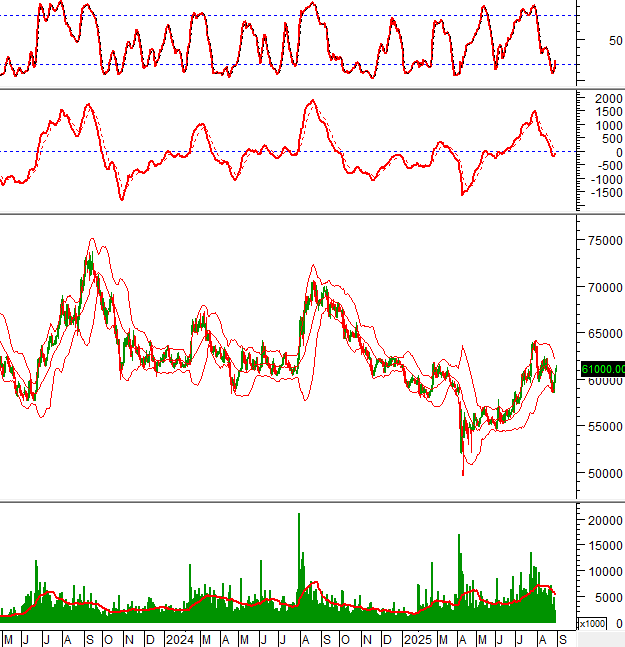
Technical Signals for the HNX-Index
In the trading session on the morning of August 28, 2025, the HNX-Index witnessed a tug-of-war and formed a Doji candlestick pattern. This indicates investors’ hesitation and indecision in the short term.
The MACD and Stochastic Oscillator indicators continued their downward trajectory after generating sell signals. However, the signal of breaking above the Middle line of the Bollinger Bands helped mitigate the risk of a deeper correction in the near term.
Trading volume is likely to remain below the 20-day average by the end of the session, making it challenging to anticipate significant short-term fluctuations.
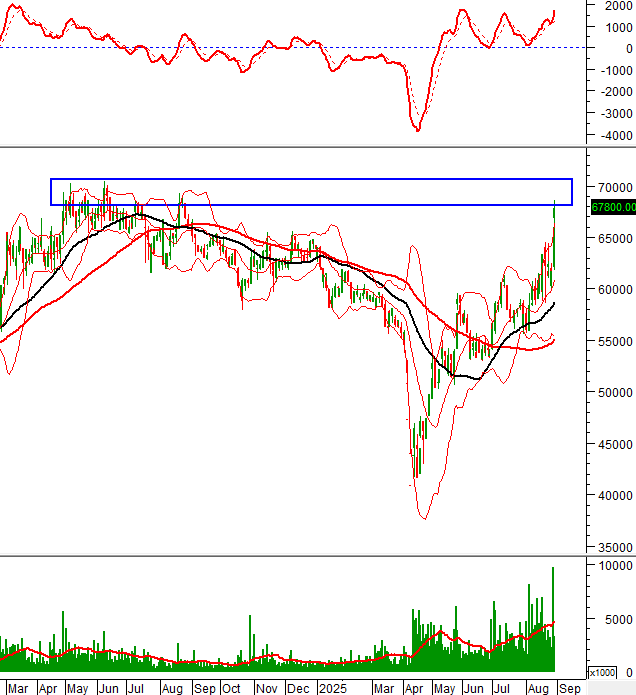
GMD – Gemadept Joint Stock Company
In the trading session on the morning of August 28, 2025, GMD’s stock price continued its upward trajectory and tested the 68,000-70,500 region (equivalent to the old peak in June 2024). This will serve as the stock’s key resistance level in the near term.
Aggressive foreign net buying in recent sessions has helped push the stock back into an upward trajectory.
The price found support from the Middle line during the recent correction and is currently hugging the Upper Band of the Bollinger Bands. If this band continues to expand, the potential for breaking above the peak is high.
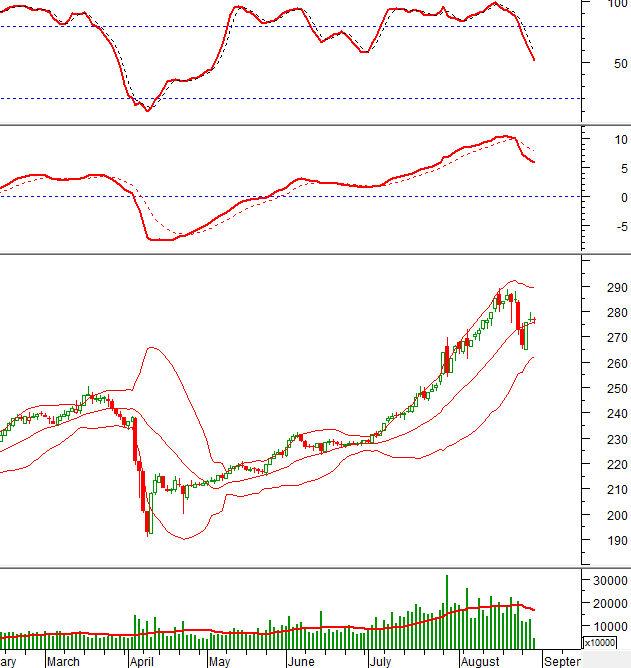
VNM – Vietnam Dairy Products Joint Stock Company
VNM’s stock price extended its growth during the trading session on the morning of August 28, 2025. Thus, the Inverted Black Hammer pattern, which signaled a bottom reversal (formed on August 25, 2025), has been confirmed by subsequent candlesticks.
The price has also moved above the Middle line of the Bollinger Bands. If this status quo is maintained until the end of the afternoon session, the short-term outlook will be quite positive.
Additionally, the Stochastic Oscillator indicator has turned upward and generated a strong buy signal in the oversold region.
(*) Note: The analysis in this article is based on real-time data up to the end of the morning session. Therefore, the signals and conclusions are for reference only and may change when the afternoon session ends.
Technical Analysis Department, Vietstock Consulting
– 12:09 28/08/2025
“Foreign Investors Sell Nearly VND 2.7 Trillion as VN-Index Surges Past 1,680 Points: Which Stocks Were in the Firing Line?”

“Foreign investors showed strong buying interest in GMD stock during the afternoon trading session, making it the most actively bought stock across the market. The net buying value stood at an impressive 135 billion VND.”
A Surprise Retail Sale: The Unlikely Target of Brokerage’s Aggressive Selling in the August 28 Session

The HoSE-listed stocks witnessed another selling spree by proprietary traders, with a net sell value of VND261 billion.
The Stock Market Shudder Before the Holiday Lull

Today’s trading session (August 28th) witnessed domestic stocks continue their volatile trend. Despite the VN-Index posting gains, investor sentiment turned cautious, resulting in a sudden drop in market participation.
The Hottest Bank Stock Before Closing Bell

Today (August 27th), while the market returned to a state of tug-of-war, VCB stock stood out by closing at the ceiling, setting a new peak of VND 69,100 per share.
The Great Sell-Off: Unraveling the Billion-Dollar Mystery on HOSE’s Trading Floor

The HoSE-listed stocks witnessed another selling spree by proprietary traders, with a net sell value of VND1,186 billion.


