BTC: Reassessing Long-Term Equilibrium Zone
As mentioned in the August 2025 Crypto Report (Part 1), BTC’s weekly price continues to move within a bullish price channel and is retesting the 100% Fibonacci Projection level (equivalent to the $105,700–$111,500 USD range). This zone serves as a critical long-term support for the cryptocurrency.
Additionally, the Bollinger Bands are narrowing (Bollinger Band Squeeze) while the ADX indicator remains in the neutral zone (10 < ADX < 25).
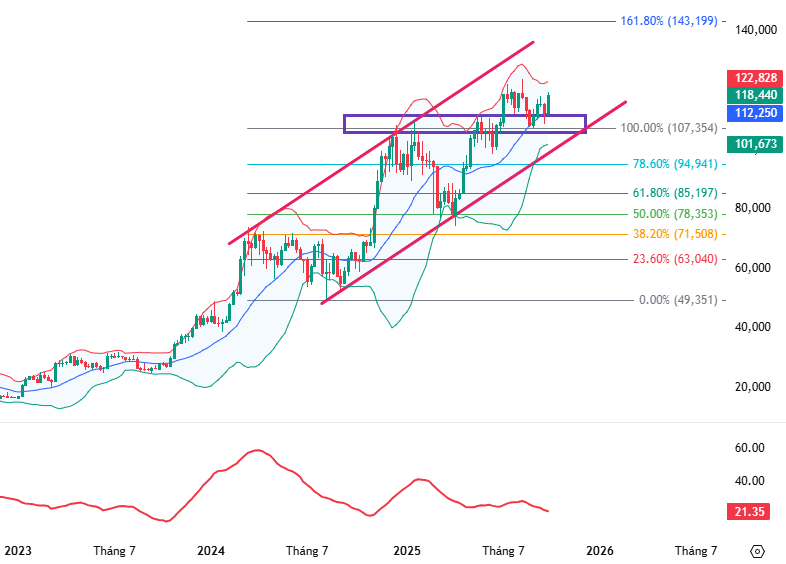
BTC Chart (2023–2025) – Source: TradingView
On the daily chart, BTC’s price has crossed above the Bollinger Bands’ Middle line, while the MACD indicator continues to rise above the zero line after previously signaling a buy. If these technical signals persist, the recovery outlook will gain further support.
In summary, the long-term uptrend remains intact, but short-term volatility risks persist. Investors should prioritize monitoring and await stronger recovery signals within the $105,700–$111,500 USD equilibrium zone.
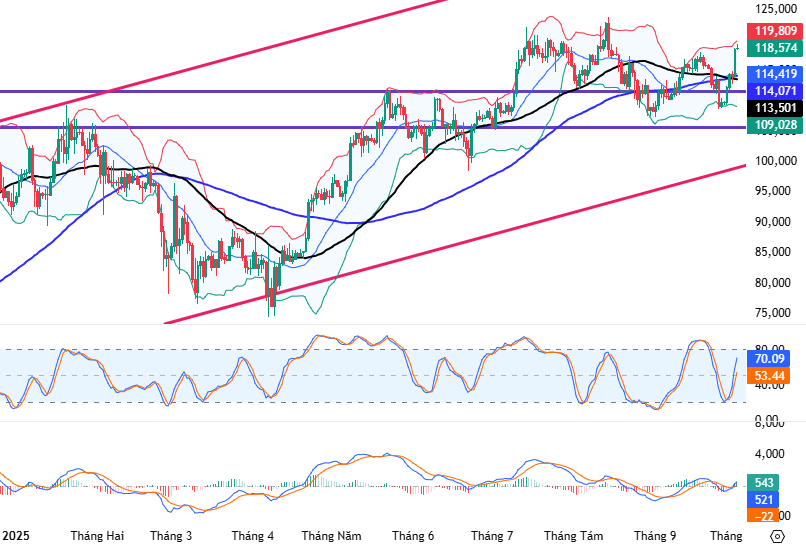
BTC Chart (2025) – Source: TradingView
ETH: Pullback Tests Neckline Resistance
On the weekly chart, ETH is experiencing a throwback, retesting the December 2024 high (around $3,900–$4,000 USD) after successfully breaking out in August 2025.
Currently, the Stochastic Oscillator is weakening after signaling a sell in the overbought region. If the indicator exits this zone, correction risks will increase. However, ETH’s price remains above the Bollinger Bands’ Middle line, which could provide support if the pullback extends.
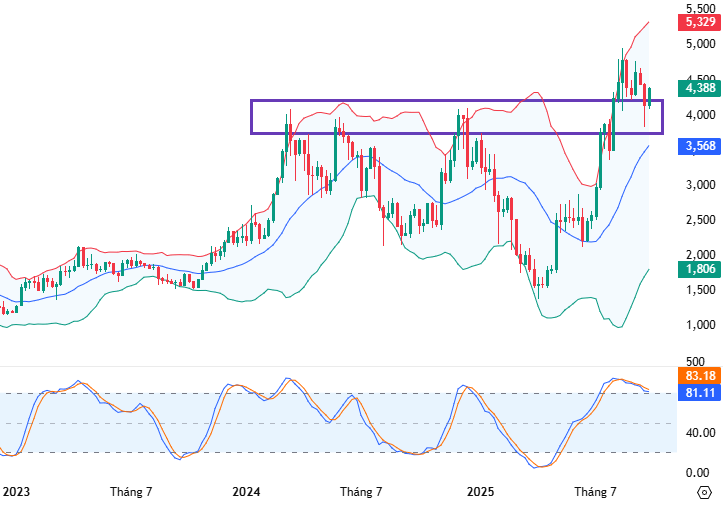
ETH Chart (2023–2025) – Source: TradingView
On the daily chart, the short-term outlook is positive, with ETH showing strong pullbacks after breaking above the Head and Shoulders pattern’s neckline (around $4,350–$4,500 USD). The Stochastic Oscillator has also shown consistent improvement.
Furthermore, ETH is finding support at the December 2024 high, while the MACD is narrowing its gap with the signal line. If a buy signal reappears and the price sustains above the Bollinger Bands’ Middle line, the short-term recovery will strengthen.
In conclusion, ETH is showing mixed signals at a critical support zone. Investors should limit trading here and await stronger confirmation signals for optimal entry positions.
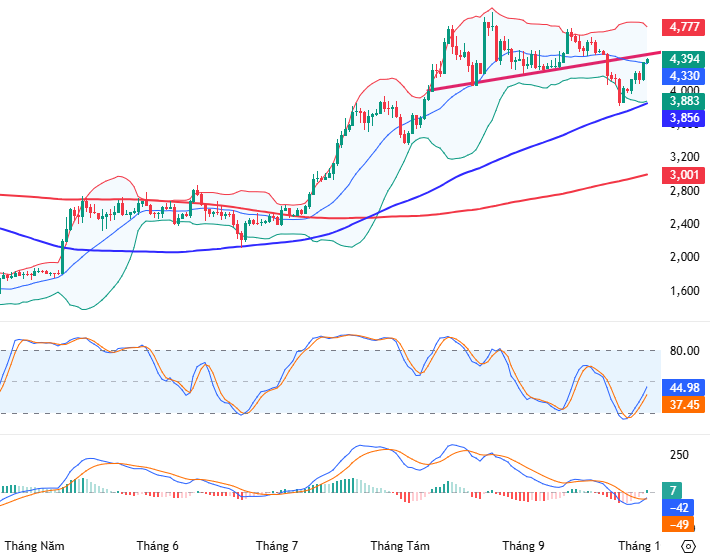
ETH Chart (2025) – Source: TradingView
Technical Analysis Team, Vietstock Advisory Department
– 09:32 03/10/2025
Afternoon Technical Analysis October 1st: Current Trend Showing Weakness

Amidst subdued ADX levels, the VN-Index is poised to persist in its sideways movement around the Bollinger Bands’ Middle line. Conversely, the HNX-Index is finding robust support at the lower boundary of its Triangle pattern, signaling potential stability in its trajectory.
Vietstock Daily 01/10/2025: Market Remains in Tug-of-War

The VN-Index remains locked in a volatile tug-of-war around the Bollinger Bands’ Middle line. While the Stochastic Oscillator has flashed a buy signal, market churn persists. The August 2025 low (1,600-1,630 range) will serve as a critical support level for the index in the coming period.
Technical Analysis for the Afternoon Session of September 30th: Continued Tug-of-War

The VN-Index remains locked in a tug-of-war around the Bollinger Bands’ Middle Line, even as the Stochastic Oscillator signals a potential buying opportunity. Meanwhile, the HNX-Index experienced a notable decline, retesting the lower boundary of its Triangle pattern.
Technical Analysis Afternoon Session 29/09: Stochastic Oscillator Signals a Buy Opportunity

The VN-Index has continued its recovery trajectory, successfully testing a robust support level and breaking above the Bollinger Bands’ Middle Line. Meanwhile, the HNX-Index remains in a state of consolidation, trading sideways within a Triangle pattern.
Vietstock Weekly (Sept 29 – Oct 3, 2025): Liquidity Lacks Momentum – Can the Market Break Through?
: Liquidity Lacks Momentum – Can the Market Break Through?")
The VN-Index edged higher following a volatile week of trading. While the MACD indicator has maintained a buy signal since May 2025, its divergence from the Signal Line is narrowing. Meanwhile, the Stochastic Oscillator continues to weaken after a sell signal in overbought territory, suggesting short-term volatility remains a risk. Additionally, declining trading volumes in recent weeks indicate a lack of momentum, making a clear breakout unlikely unless liquidity improves soon.


: Mixed Signals Emerge")


