 |
By the end of 2023, VN-Index increased by more than 12% compared to the previous year, but most of the growth came from small and mid-cap stocks. Evidence is the VN30-Index, representing the 30 large-cap stocks in Vietnam, which had periods of lower performance than the VN-Index, something rarely seen in many years. This also means that investment funds will face many difficulties, as funds often focus on large-cap stocks. To achieve good profits in the past year, funds had to have the ability to choose good industry sectors or have flexible trading strategies to take advantage of short-term market fluctuations.
This article analyzes the investment strategies of the DC Dynamic Security Fund (DCDS) of Dragon Capital Fund Management Company and the Market Access Stock Investment Fund (VESAF) of VinaCapital Fund Management Company, the largest fund management companies in the Vietnamese stock market. The annual returns of DCDS and VESAF measured from the beginning of the year to the end of November 2023 were 22.39% and 27.62%, respectively, much higher than the general return of VN-Index at the same period.
Both funds have a balanced investment strategy by combining the target allocation ratio of stocks and bonds at 80/20. The investment policy of the two funds allows flexibility in choosing the allocation ratio between stocks and bonds to take advantage of short-term market opportunities. The changes in the asset allocation and stock portfolios of the two funds throughout the year will provide us with insights into how they allocate different asset classes, then different industry groups, and how they allocate stocks over time, especially during periods of large market fluctuations, to explain the difference in returns between the two funds and the VN-Index.
Flexible allocation of asset classes based on market trends
The allocation of assets in the funds shows significant differences, reflecting their different views on market prospects. The stock allocation ratio of VESAF is lower than the 80% target, while that of DCDS is considerably higher. This reflects VESAF’s more cautious approach to market prospects at the beginning of 2023.
 |
Both funds tend to increase the stock allocation in the investment portfolio as the economic outlook improves. The stock allocation of DCDS increased rapidly from May 2023, which coincided with the continuous increase of the VN-Index from May to August 2023. The reason for the strong increase in stock allocation and decrease in other assets is that when the VN-Index rises or the stock market is doing well, the value of the stocks held in the portfolio becomes more positive. Therefore, the funds believe that holding bonds and cash at this time is less attractive than stocks, and they start accumulating more stocks.
When the market fluctuated in September and October, DCDS’s active trading strategy was maximized. The fund began to decrease the stock allocation and lock in profits from the beginning of the year in October. When the market recovered, the fund increased the stock allocation again in November. Meanwhile, VESAF’s stock allocation remained stable throughout the year.
From these observations, we can see that the trading frequency is also one of the indicators that reflect the difference in investment strategies between the two funds. In January 2023, DCDS had a significantly higher trading frequency than VESAF, peaking in September 2023 – 70 times higher than VESAF. This led to a higher turnover ratio for DCDS, with an average of 4-6 turnovers, while VESAF was less than 1 turnover.
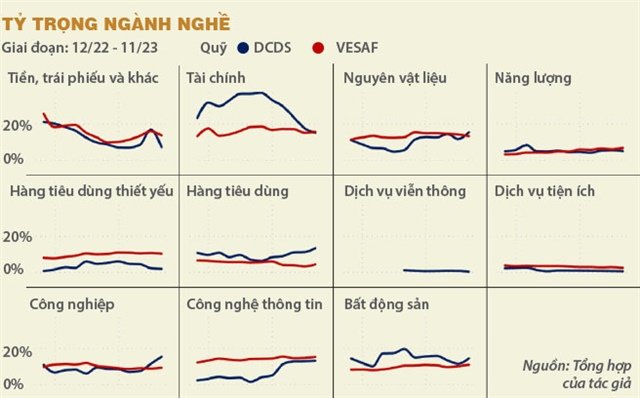
Flexible allocation of industry sectors
Both funds allocate the most to the financial and real estate sectors, which are the largest sectors in the VN-Index. However, the allocation of sector weights between the two funds varied over the quarters. Generally, the fluctuations in sector allocation in DCDS’s portfolio were greater than in VESAF’s portfolio. Over the past year, the sector weights in VESAF’s portfolio have been relatively stable, with small changes, reflecting a trend of holding. On the other hand, DCDS had larger fluctuations in the weights of sectors, most notably in the second half of 2023.
In the early months of 2023, DCDS held stocks in the financial sector with a weight around 30-35%, while VESAF only held 13-17% in the portfolio. However, since the end of June 2023, DCDS has steadily reduced the weight of the financial sector, bringing it closer to VESAF’s weight in November 2023, which were 14.96% and 15.48%, respectively. This reflects DCDS’s pessimistic view on financial stocks and banks. VCB, a stock in the financial sector, had the highest weight reduction in DCDS’s portfolio during this period, from 7.64% in June 2023 to 0% in November 2023, meaning the fund has completely divested its investment in this bank.
Conversely, DCDS significantly increased the weight of the information technology sector in its portfolio, approaching the weight of VESAF for this sector. This sector was also one of the best-performing sectors in 2023, with good business performance despite the challenging economic conditions. The increase in the sector weight contributed significantly to the superior returns of DCDS compared to the VN-Index in the overall portfolio for 2023.
For the real estate sector, despite many government initiatives to remove difficulties, there seems to be no clear recovery, and the sector has had slower growth compared to the previous year in the stock market. That’s why the sector weight seems to fluctuate sideways in both funds’ portfolios. VESAF has the advantage of allocating a lower weight to this sector compared to DCDS.
Changes in the stock portfolio

The table provides us with a more detailed insight into the changes of the top 5 stocks in the portfolios of the two funds throughout the year. One point to note is that the overall stock allocation did not change much because the funds reduced the weight in one sector but increased the weight in another. In DCDS’s portfolio, at the end of August 2023, FPT had the largest increase and replaced VCB as the highest-weighted stock, with a weight of around 11-13%. In contrast, the top 5 stocks of VESAF remained fixed, revolving around a few stocks such as FPT, MWG, MBB, QNS, and FMC. Both funds had a commonality of allocating more than 10% weight to FPT stock in their portfolios, with DCDS starting from the end of August.
Both funds achieved significantly higher returns than the VN-Index, but the source of their returns may be different. For VESAF, the returns came from allocating a balanced portfolio structure between stocks and bonds, as well as selecting suitable industry sectors, such as increasing the weight in technology and reducing the weight in banking and real estate sectors. This allowed the fund to avoid frequent trading during the volatile year. On the other hand, for DCDS, the returns may come from stock selection and a dynamic trading strategy for stocks that were not properly priced, which is likely the source of the fund’s returns.
Therefore, the returns of DCDS and VESAF reflect both passive and active investment strategies that can generate good returns, even in volatile market conditions, if the strategies are consistently implemented with a method. These will be valuable reference lessons for individual investors in choosing the appropriate investment strategies based on their own capabilities to prepare for 2024.
Le Hoai An – Co Van Tan


