


: Returning to Critical Support Levels?")


MARKET ANALYSIS STOCK WEEK 15-19/01/2024
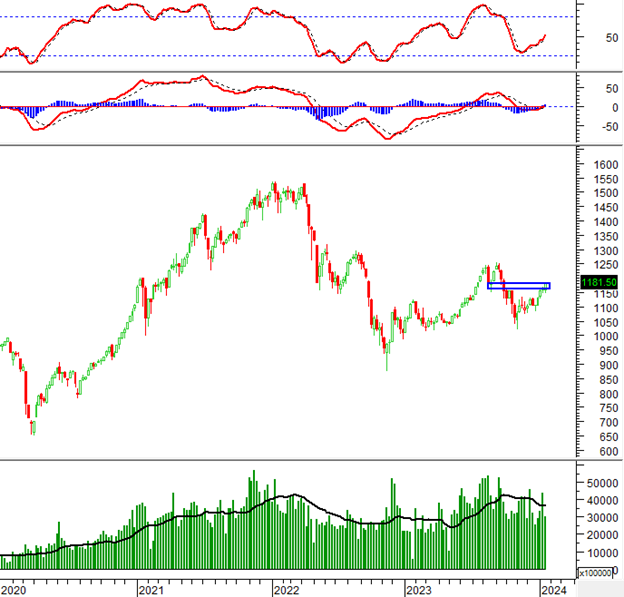
During the week of 15-19/01/2024, VN-Index showed strong growth and surpassed the previous resistance level from August 2023 (equivalent to the range of 1,160-1,180 points), indicating a positive sentiment among investors.
In addition, the MACD indicator provided a buy signal and crossed above the 0 level, indicating that the upward momentum is likely to continue.
TECHNICAL ANALYSIS
Trend and Price Oscillation Analysis
VN-Index – Formation of Rising Window candlestick pattern
In the trading session on 19/01/2024, VN-Index surged and successfully broke through the Fibonacci Retracement 61.8% level (equivalent to the range of 1,160-1,170 points), while forming the Rising Window candlestick pattern, reflecting optimistic investor sentiment.
In addition, the MACD indicator continues to trend upwards, indicating a positive outlook in the short term.
However, the trading volume remains below the 20-day average. If the money flow improves in the near future, the upward momentum could be further strengthened.

HNX-Index – Formation of Inverted Hammer candlestick pattern
In the trading session on 19/01/2024, HNX-Index formed the Inverted Hammer candlestick pattern, indicating continued selling pressure.
In addition, the Bollinger Bands are tightening while the ADX continues to move below the 20 level in recent sessions. This suggests that the tug-of-war situation is likely to persist in the near future.
Currently, HNX-Index is closing near the lower edge of the Ascending Triangle pattern. If a positive outlook reemerges and the index breaks above the upper edge (equivalent to the range of 232-235 points), the potential price target will be the range of 252-254 points.

Money Flow Analysis
Smart money movement: The Negative Volume Index of VN-Index has crossed above and is now above the 20-day EMA. Therefore, the risk of sudden downward thrust will be limited.

Technical Analysis Department, Vietstock Advisory Department


