Technical signals of VN-Index
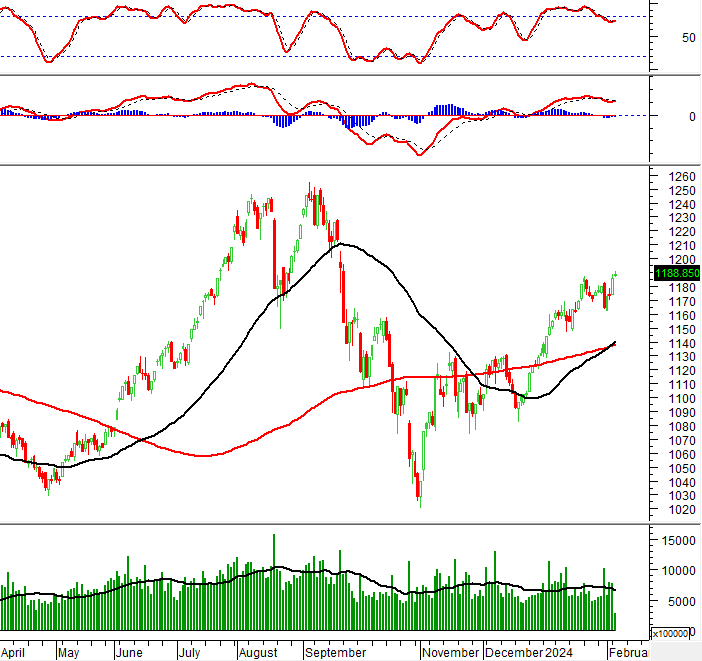
In the morning trading session on February 6, 2024, VN-Index slightly increased while displaying a Doji candlestick pattern with a small body, indicating cautious investor sentiment.
In addition, the volume remained low and is expected to be below the 20-day average after the end of the trading session.

Technical signals of HNX-Index
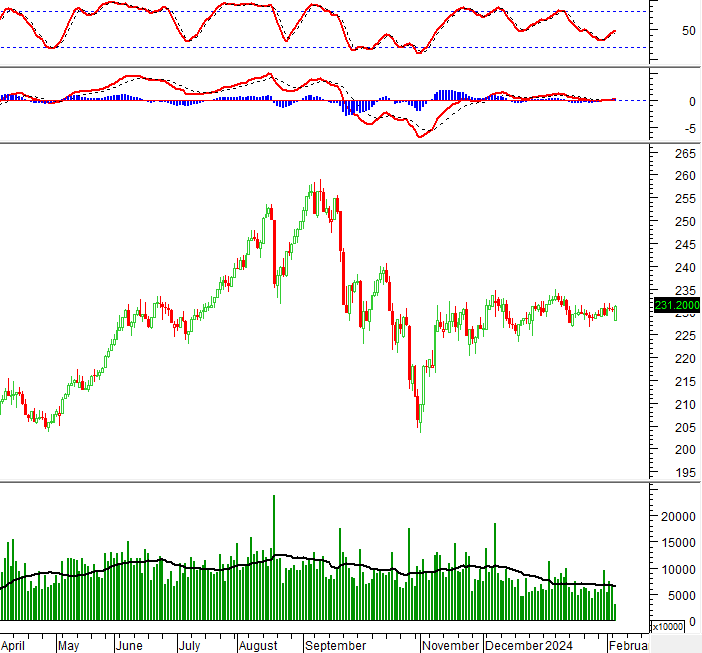
In the trading session on February 6, 2024, HNX-Index increased and showed a Bullish Engulfing candlestick pattern, indicating positive investor sentiment.
However, the trading volume needs improvement and should remain above the 20-day average in the near future to consolidate the upward trend.
Currently, both Stochastic Oscillator and MACD indicators give positive buying signals, indicating a positive outlook.

FRT – Digital Retail Joint Stock Company FPT
In the morning session on February 6, 2024, FRT increased and continued to closely follow the Upper band while the Bollinger Bands continued to expand, and a long-bodied candlestick pattern appeared, indicating a very positive outlook.
In addition, the trading volume continued to exceed the 20-day average, indicating a large amount of money flowing back into this stock.
Currently, the ADX indicator continues to rise above the 30 level, indicating a strong current upward trend that is likely to continue in the coming sessions.

DGC – Duc Giang Chemical Group
In the morning trading session on February 6, 2024, DGC stock increased significantly while displaying a candlestick pattern similar to Marubozu, and the volume is expected to exceed the 20-day average at the end of the session, indicating active trading by investors.
In addition, the MACD is trending up towards the 0 level after giving a buy signal. If it surpasses this level, it is likely that the upward trend will continue to be reinforced.
Currently, the price of DGC stock is continuing to recover after testing the lower edge of the Ascending Triangle pattern. If DGC surpasses the upper edge (equivalent to the range of 94,900-98,900) of the pattern, the potential price target will be the range of 128,300-132,300.

Technical Analysis Department, Vietstock Advisory Division


