Technical Signals of VN-Index
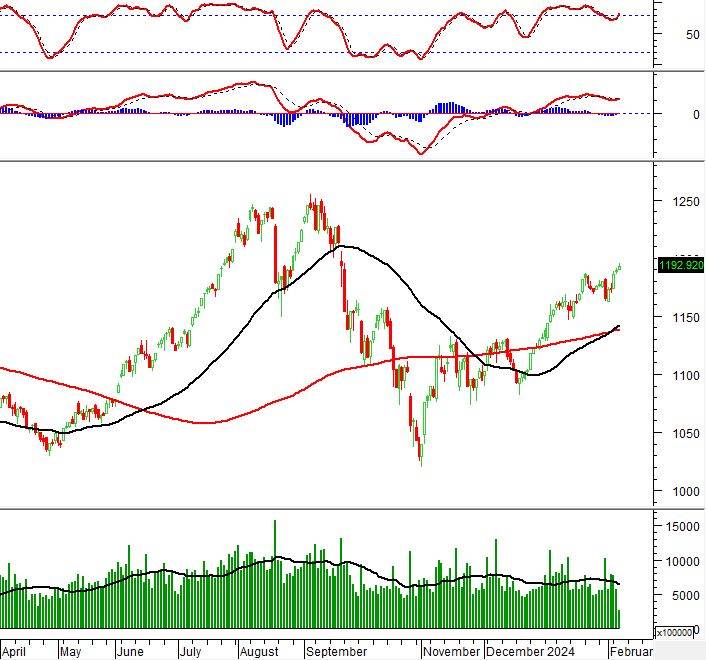
In the morning trading session on February 07, 2024, VN-Index slightly increased while the Golden Cross signal between the 50-day SMA and the 200-day SMA remained strong.
Currently, the Stochastic Oscillator indicator has entered the overbought zone. If a sell signal appears in the near future, the risk of correction will increase.
Technical Signals of HNX-Index
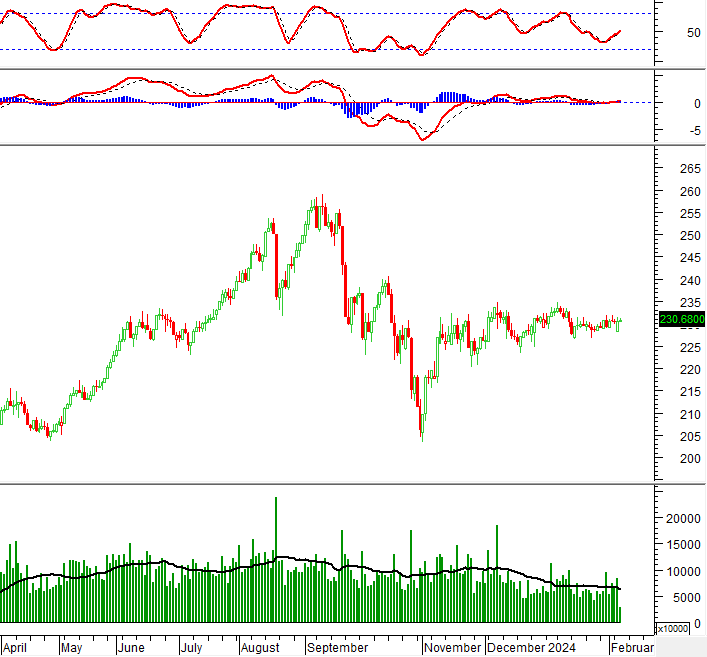
In the trading session on February 07, 2024, HNX-Index increased and formed a candlestick pattern similar to the Inverted Hammer, indicating cautious sentiment among investors.
In addition, the trading volume remained low and is expected to stay below the 20-day moving average after the trading session ends.
However, the MACD indicator is still above the zero level and giving a buy signal, indicating that the outlook is not overly pessimistic.
DBC – Dabaco Vietnam Corporation
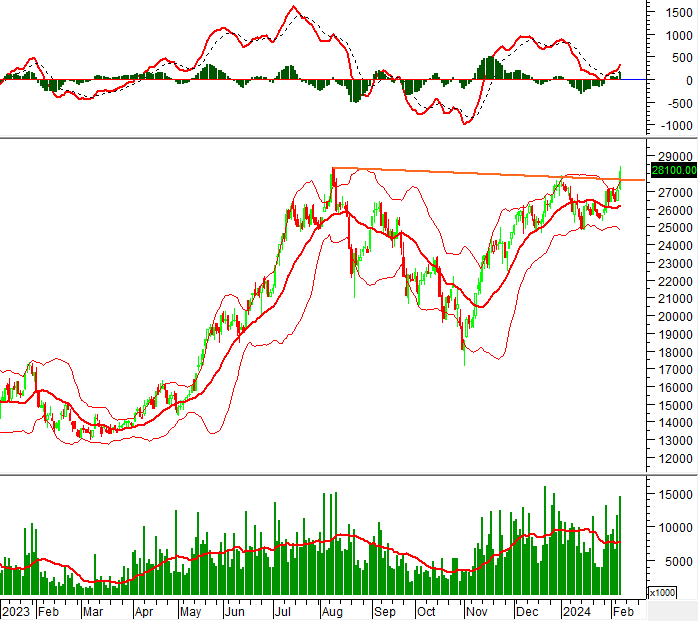
In the morning session on February 07, 2024, the stock DBC rebounded and continued to stay above the middle line of the Bollinger Bands, indicating that positive prospects are still present.
The trading volume continued to exceed the 20-day moving average in the context of the MACD trending higher after a buy signal appeared, indicating that significant capital has returned to this stock.
Currently, the price of DBC stock has broken above the Neckline of the Cup and Handle pattern. If the upward trend continues, the price target in the near future will be the range of 38,300-39,300.
DCM – Ca Mau Fertilizer and Oil Corporation
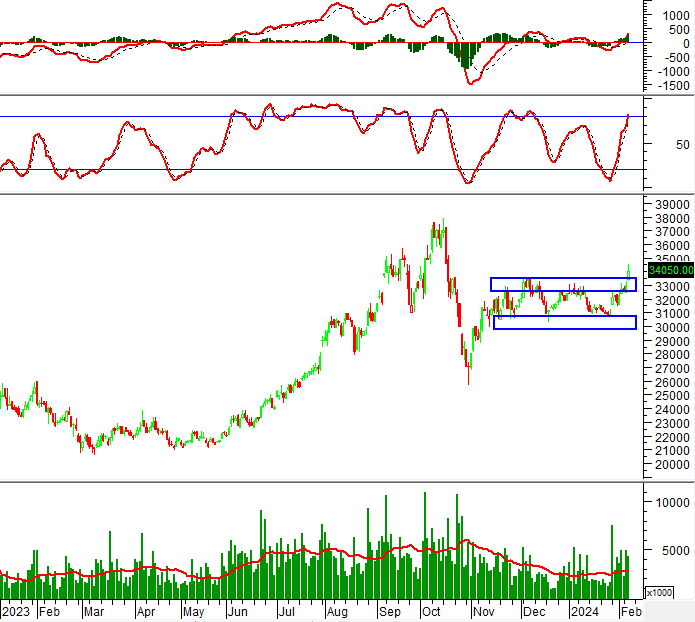
In the morning trading session on February 07, 2024, the stock DCM increased significantly and formed a long-bodied candlestick pattern with a trading volume exceeding the 20-day moving average, showing optimistic sentiment among investors.
Currently, the price of DCM stock has successfully surpassed the upper edge (equivalent to the range of 32,500-33,500) of the Rectangle pattern. The potential price target will be the range of 36,300-37,300 if the upward momentum continues to be consolidated in the upcoming sessions.
Technical Analysis Department, Vietstock Advisory Division


