


Technical signals of VN-Index
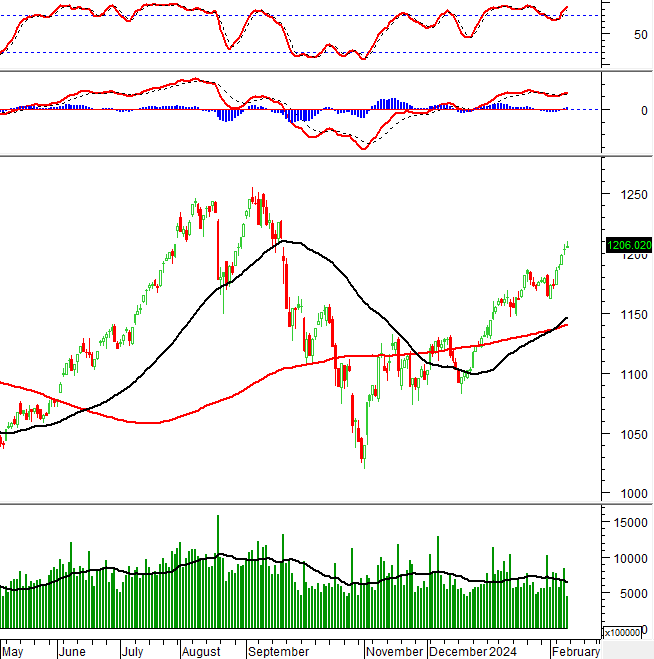
In the morning trading session on February 16, 2024, VN-Index increased and formed a Doji candlestick pattern. This indicates that strong selling pressure has caused the index’s upward momentum to narrow in the morning session.
The trading volume has increased significantly and is expected to exceed the 20-day average, indicating active trading activity.
Currently, the Stochastic Oscillator has entered the overbought zone. Investors should be cautious if this indicator shows a sell signal.
Technical signals of HNX-Index
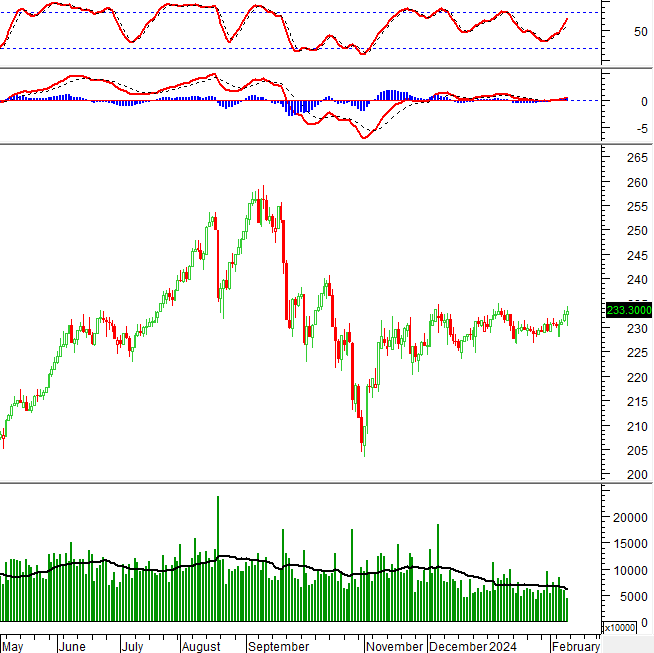
In the trading session on February 16, 2024, HNX-Index increased and formed a High Wave Candle pattern, indicating the investors’ indecisiveness.
The Stochastic Oscillator and MACD continue to rise after giving buy signals. On the other hand, the trading volume has improved and is expected to exceed the 20-day average by the end of the session.
NTL – Urban Development Corporation Từ Liêm
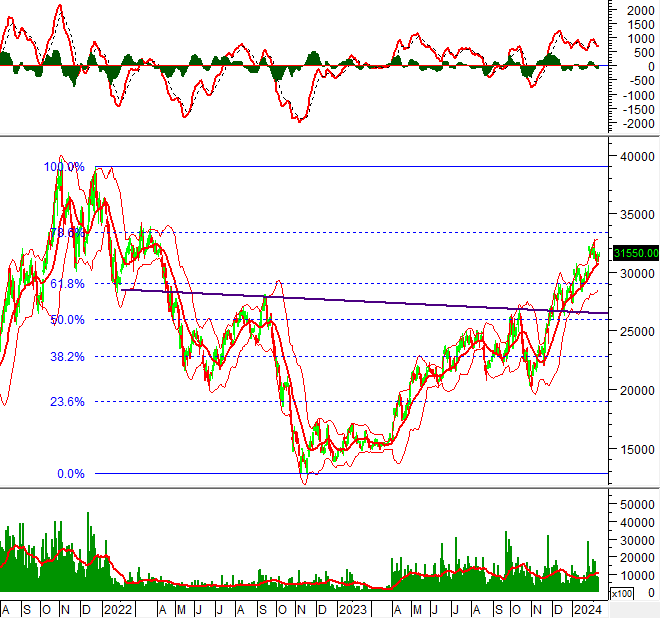
In the morning trading session on February 16, 2024, NTL increased and formed a High Wave Candle pattern with an increasing trading volume, reflecting investors’ indecisiveness.
However, the price of NTL has been creating higher highs and higher lows and is still above the Middle line of Bollinger Bands, indicating a positive outlook.
Currently, NTL has broken the neckline of the Inverse Head and Shoulders pattern. If the price continues to maintain an upward trend and surpasses the Fibonacci Retracement 78.6% level (equivalent to the range of 33,000-35,000), the potential price target can reach the range of 40,300-42,500.
VNM – Vietnam Dairy Products Joint Stock Company
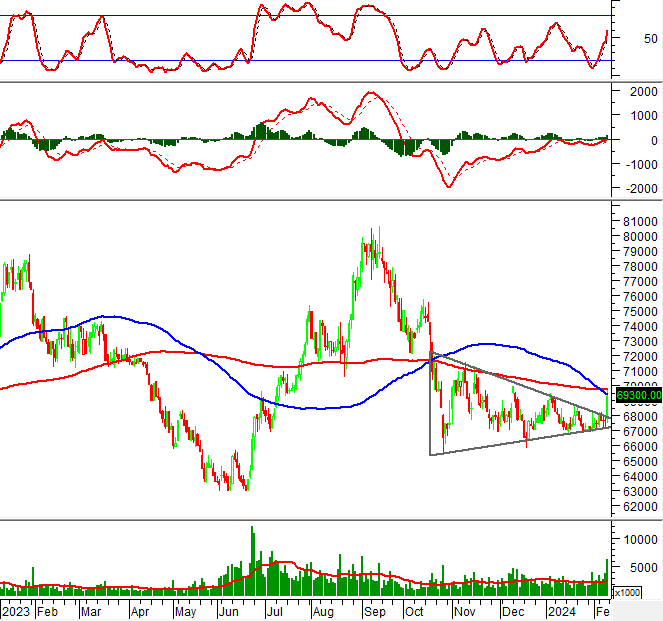
In the morning trading session on February 16, 2024, VNM increased significantly and formed a long-bodied candlestick pattern with a continuously rising trading volume, indicating active trading activity by investors.
In addition, the MACD and Stochastic Oscillator have given buy signals and are trending upward, further confirming the recovery momentum.
The stock price has successfully broken the upper edge of the Triangle pattern. If the price continues to surpass the group of moving averages such as the 100-day SMA and the 200-day SMA, the price target could be the range of 73,500-74,500 in the near future.
Technical Analysis Department, Vietstock Advisory


