

: Will a Surge in U.S. Purchases Spark a Rebound?")


: A Mixed Bag of Wins and Woes")


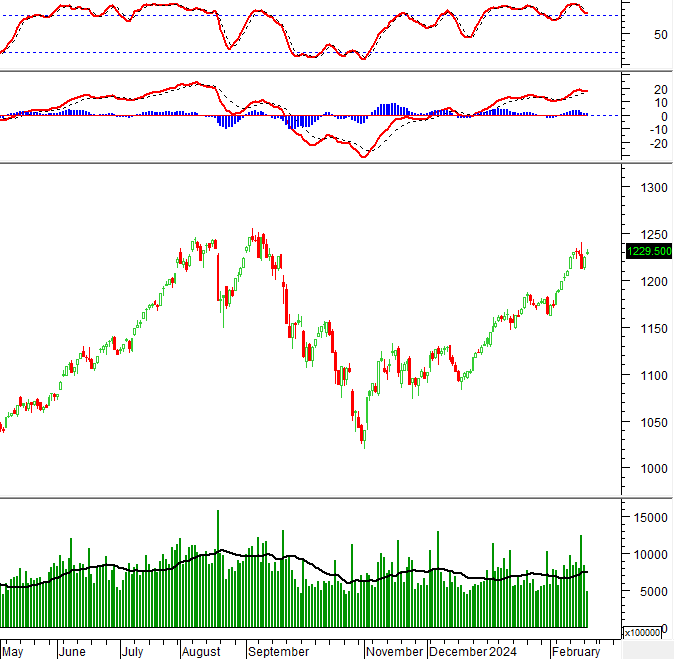
Technical Signals of VN-Index
During the morning trading session on February 27, 2024, VN-Index made gains while forming a Doji candlestick pattern, indicating that investor sentiment is still uncertain.
The money flow witnessed a strong comeback with very positive trading volume in the morning session, and it is expected to surpass the 20-day average after the session ends.
However, the Stochastic Oscillator is still signaling a sell in the overbought zone, so caution should be exercised if a correction risk re-emerges in the near future.
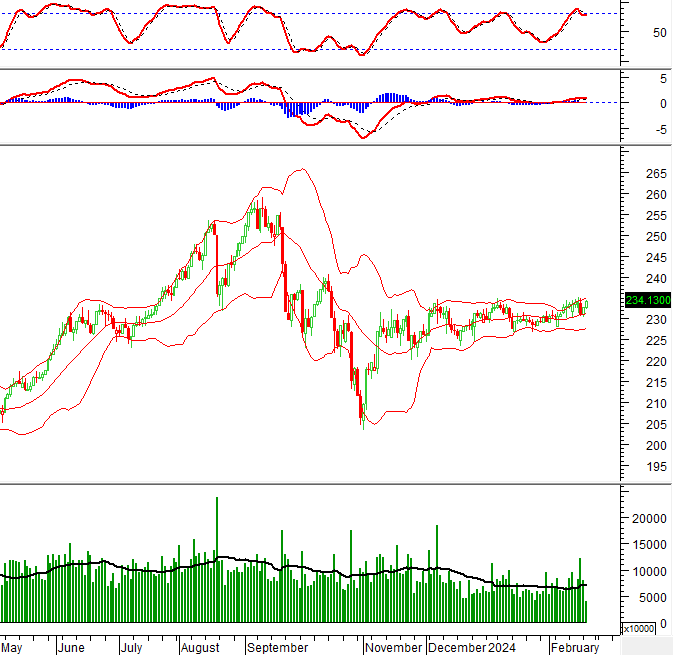
Technical Signals of HNX-Index
During the trading session on February 27, 2024, HNX-Index gained points while maintaining its position above the Middle line of the Bollinger Bands since the beginning of February 2024. This indicates that this line has been providing good support for the index in recent times.
Currently, the MACD indicator has signaled a buy and continues to move upward, so the short-term prospects for the index are not overly pessimistic.
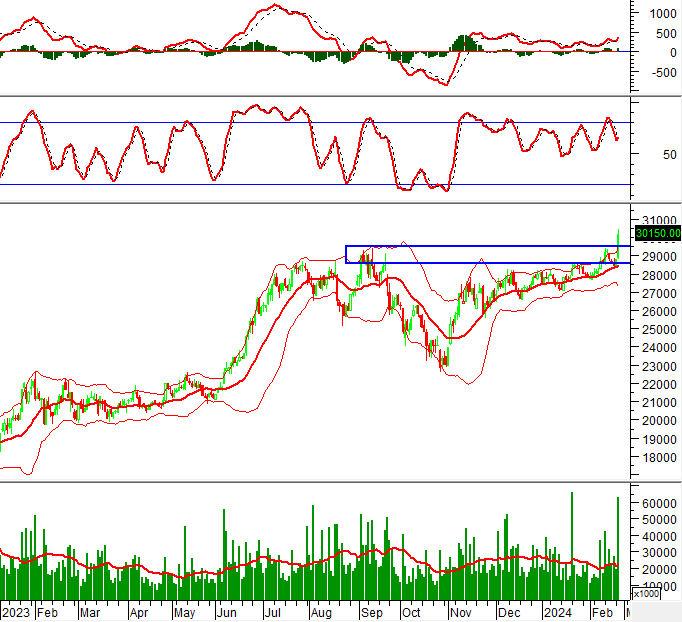
HPG – Hoa Phat Group Joint Stock Company
During the morning session on February 27, 2024, HPG shares surged strongly while displaying a long-bodied candlestick pattern along with trading volume above the 20-day average, indicating a very optimistic investor sentiment.
In addition, the MACD indicator continues to form higher highs and higher lows after the buy signal appeared, indicating that the upward momentum is being reinforced.
Currently, HPG has set a new 52-week high after successfully surpassing the previous peak in September 2023 (equivalent to the range of 28,500-29,500). This will be a strong support level for this stock in the near future.
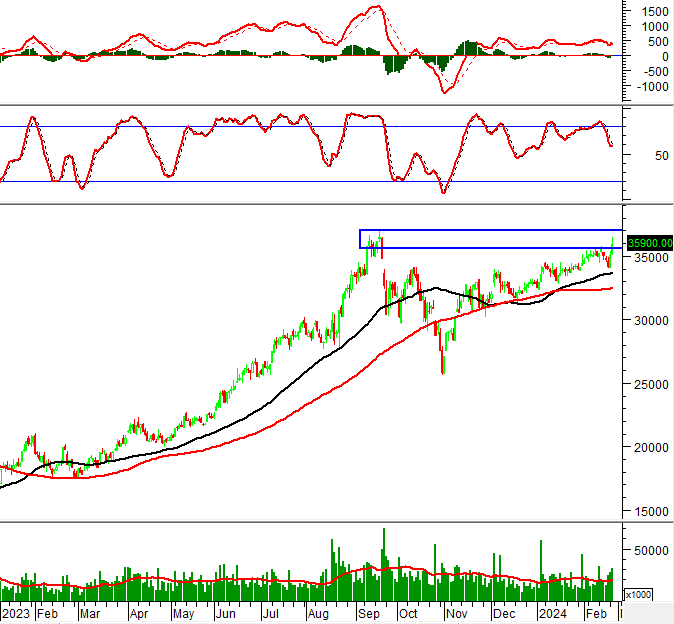
SSI – SSI Securities Corporation
During the morning trading session on February 27, 2024, the price of SSI shares increased along with continuously improving trading volume in recent sessions and surpassed the 20-day average, indicating that investors are actively trading.
However, the Stochastic Oscillator is showing a bearish divergence as the price of SSI is retesting the previous peak in September 2023 (equivalent to the range of 35,500-37,000), so there is a high possibility of some fluctuations around this level.
Technical Analysis Department, Vietstock Advisory Department


