
 Reports Significant Profit in Q1 2024")


Technical signals of VN-Index
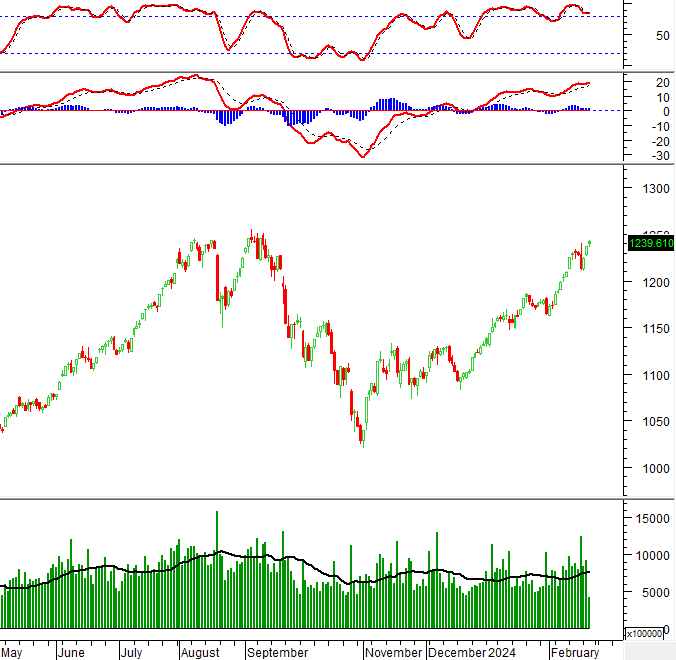
In the morning session on February 28, 2024, VN-Index increased its points along with the appearance of the High Wave Candlestick pattern, indicating investor indecision.
However, the MACD indicator continues to trend upwards after giving a buy signal, with trading volume staying stable above the 20-day average during the recent period. This suggests that the outlook is not overly pessimistic.
Technical signals of HNX-Index
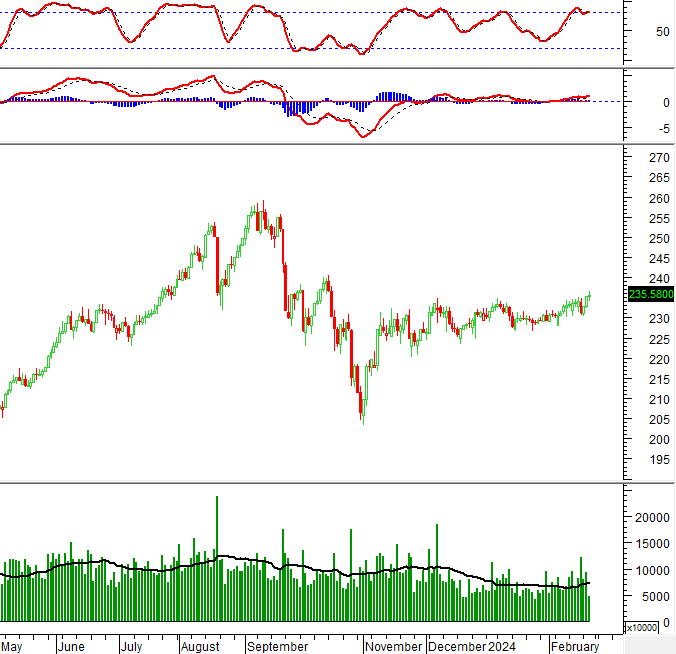
In the trading session on February 28, 2024, HNX-Index slightly increased while the Doji candlestick pattern appeared, showing investor indecision.
In addition, the Stochastic Oscillator indicator is still giving a sell signal in the overbought zone, so caution is advised if the risk of a correction reappears.
PLX – Vietnam Petroleum Corporation
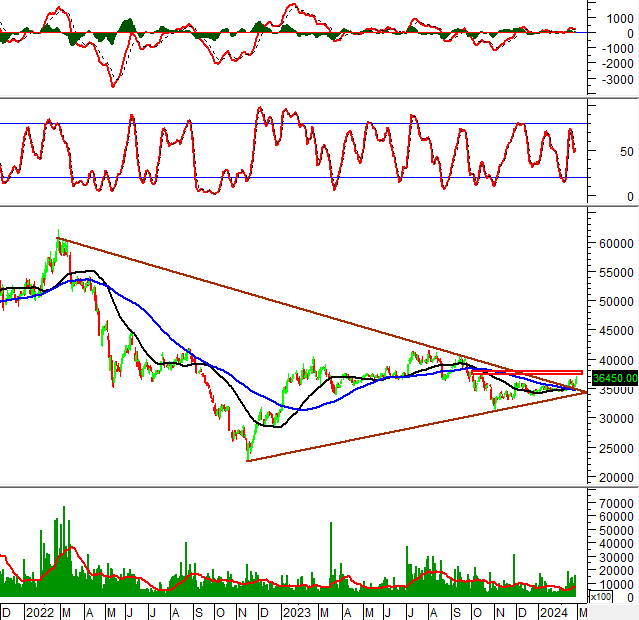
In the morning session on February 28, 2024, the stock price of PLX continued to rise after the appearance of a Golden Cross between the 50-day SMA and the 100-day SMA, indicating positive long-term prospects.
In addition, the trading volume exceeded the 20-session average, while the MACD indicator continued to trend upwards after giving a buy signal, confirming the ongoing recovery momentum.
Currently, PLX has successfully thrown back to the long-term downtrend trendline and is heading towards the previous peak in October 2023 (equivalent to the range of 37,200-37,900). This will be a potential resistance zone for this stock in the near future.
VSC – Vietnam Container Corporation
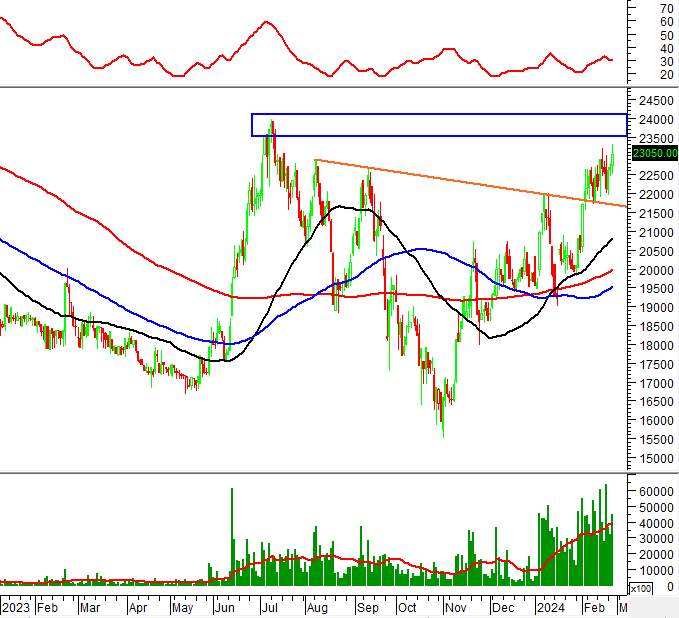
In the morning trading session on February 28, 2024, VSC stock rose and continued to stay above the Middle line of the Bollinger Bands in recent sessions, with an ADX above 30 indicating a strong upward trend.
The volume improved in the morning session and exceeded the 20-session average, indicating active trading by investors.
In addition, VSC stock successfully broke the Neckline of the Inverse Head and Shoulders pattern. If the price continues to surpass the previous peak in July 2023 (equivalent to the range of 23,500-24,100) in the near future, the price target could reach the range of 28,200-28,800.
Technical Analysis Department, Vietstock Advisory Department


