


Weekly Market Outlook for April 01-05, 2024
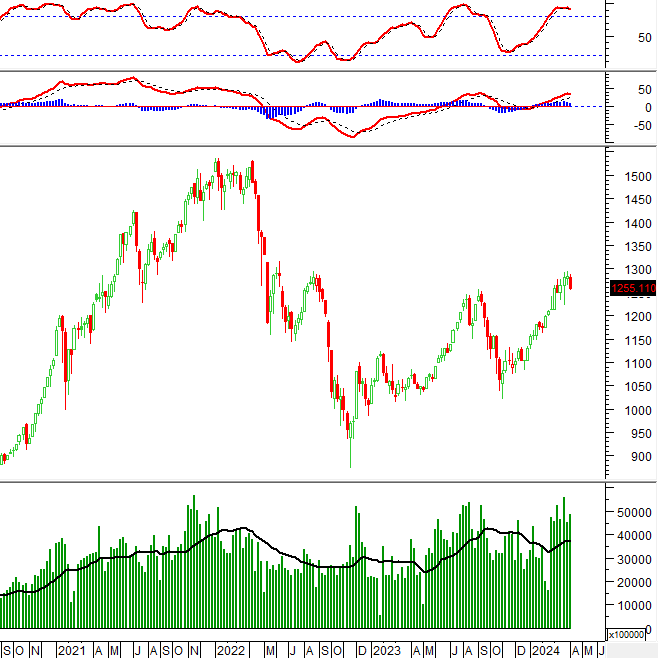
During the week of April 01-05, 2024, the VN-Index declined sharply, with the appearance of a long-bodied red candle, reflecting the negative sentiment among investors over the past week.
Trading volume remained above the 20-week average, indicating that money has not yet exited the market.
The Stochastic Oscillator has given a sell signal in the overbought zone, suggesting that a short-term correction may occur in the near future if the indicator falls out of this zone.
TECHNICAL ANALYSIS
Trend and Price Oscillation Analysis
VN-Index – ADX is in a gray zone (20<>
In the trading session on April 05, 2024, the VN-Index fell, with the appearance of a candlestick pattern similar to an Inverted Hammer, accompanied by an increase in volume that exceeded the 20-session average, indicating that investor sentiment has become pessimistic.
In addition, the index has crossed below the Middle line of the Bollinger Bands while the MACD continues to trend down after giving a sell signal, suggesting that the short-term outlook remains negative.
Currently, the VN-Index is retesting the 61.8% Fibonacci Projection level (corresponding to the 1,250-1,265 point zone) while ADX is in a gray zone (20

HNX-Index – Appearance of Three Black Crows candlestick pattern
In the trading session on April 05, 2024, the HNX-Index continued to decline for the third day, with the appearance of a Three Black Crows candlestick pattern, accompanied by volume exceeding the 20-session average, indicating very pessimistic investor sentiment.
In addition, the index has retested the previous high of October 2023 (equivalent to the 236-240 point zone) while the Stochastic Oscillator has fallen out of the overbought zone after a sell signal appeared. There is a high probability that a bearish scenario could occur if the HNX-Index breaks below this previous high in the coming sessions.

Money Flow Analysis
Smart money flow movement: The Negative Volume Index indicator of the VN-Index has crossed below the 20-day EMA. Therefore, the risk of a sudden decline (thrust down) will increase.

Foreign capital flow movement: Foreign investors returned to net selling in the trading session on April 05, 2024. If foreign investors maintain this action in the coming sessions, the situation will become more bearish.
Technical Analysis Department, Vietstock Advisory


