


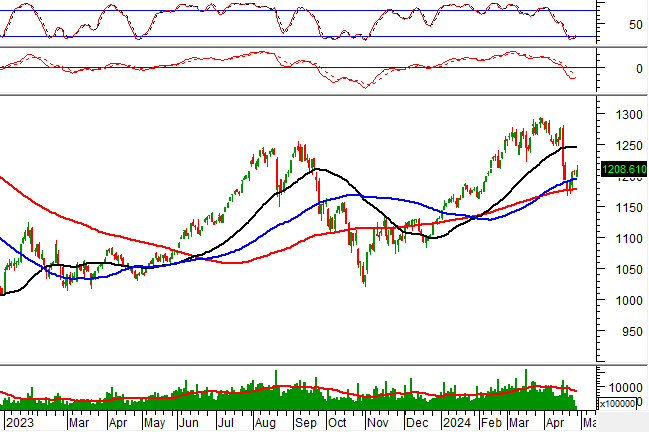
Technical Signals of VN-Index
In the trading session on the morning of April 26, 2024, VN-Index increased points with a slightly increased trading volume in the morning session, indicating that the uncertainty of investors still remains.
Currently, the index is being supported quite well by the SMA 100 day and SMA 200 day group (equivalent to the area of 1,170-1,195 points). In the following sessions, if VN-Index keeps recovering, the prospect in the medium-term trend will be more positive.
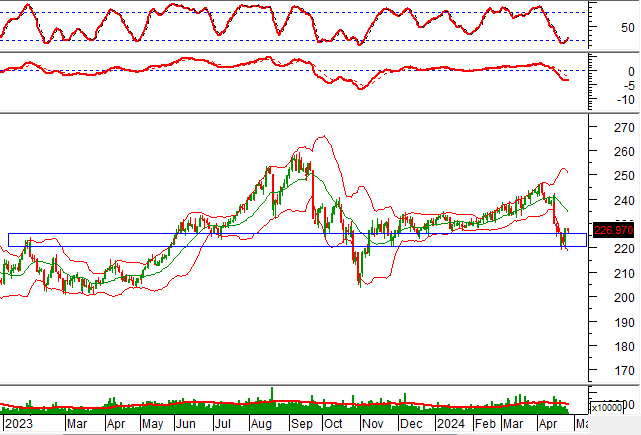
Technical Signals of HNX-Index
In the trading session on April 26, 2024, HNX-Index slightly decreased with the appearance of the High Wave Candle pattern and a slight increase in liquidity in the morning session, indicating that investor sentiment is quite uncertain.
Moreover, the index is still re-testing the old peak, which was broken in January 2023 (equivalent to the area of 220-226 points) in the context that the MACD indicator is narrowing the gap with the Signal line. If the indicator shows a buy signal again, the recovery scenario will soon appear.
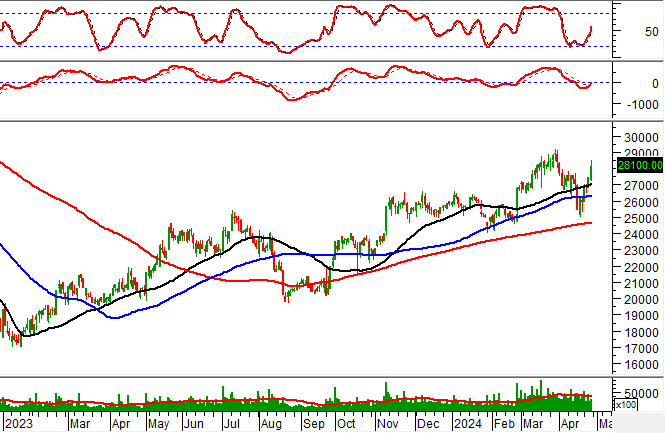
BAF – BAF Agriculture Joint Stock Company
In the morning session of April 26, 2024, BAF increased points with the appearance of the Bullish Engulfing candlestick pattern and a significant increase in trading volume, and the writer predicts that it will exceed the 20-day average when closing the session, indicating that investor sentiment is quite positive.
Besides, the MACD indicator crossed above 0 after giving a buy signal earlier. This further confirms the stock’s recovery in the coming sessions.
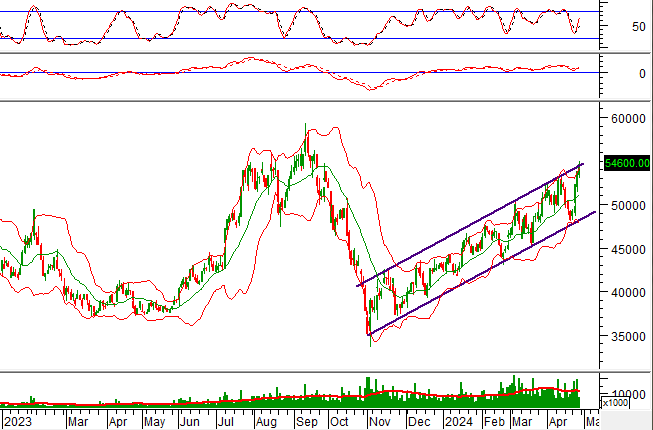
MWG – Mobile World Investment Corporation
In the morning session of April 26, 2024, MWG increased points after the appearance of the Three White Soldiers candlestick pattern and sticking to the upper band of Bollinger Bands, indicating that a positive prospect in the short term is emerging.
In addition, the MWG price is re-testing the upper edge of the Bullish Price Channel and is heading towards the old peak of September 2023 (equivalent to the area of 57,300-59,300) while both the MACD and Stochastic Oscillator indicators are giving buy signals again and heading upwards. This further confirms the current uptrend.
Technical Analysis Department, Vietstock Consulting Room


