MARKET REVIEW FOR JUNE 24-28, 2024
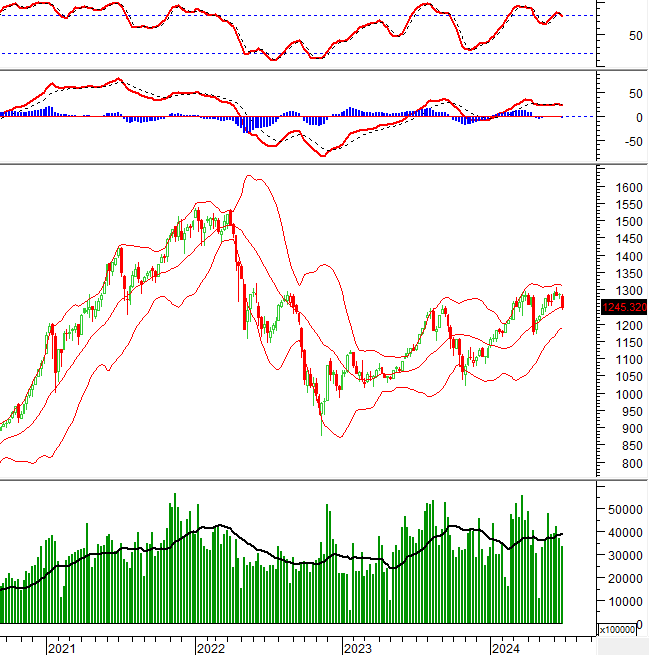
During the week of June 24-28, 2024, the VN-Index ended the week with a significant drop, as indicated by the long red candle cutting down through the Middle line of the Bollinger Bands. This reflects the negative sentiment among investors.
Additionally, both the Stochastic Oscillator and MACD indicators have generated sell signals, suggesting that the risk of a downward correction persists.

TECHNICAL ANALYSIS
Trend and Price Oscillation Analysis
VN-Index – Stochastic Oscillator Enters Oversold Territory
On June 28, 2024, the VN-Index declined, remaining close to the lower band (Lower Band) of the Bollinger Bands, while trading volume increased compared to the previous session, indicating a rather pessimistic outlook.
Currently, the index is approaching the lower edge (corresponding to the 1,215-1,235 point range) of the Rising Wedge pattern, while the Stochastic Oscillator has entered the oversold region. Should the indicator generate a buy signal and move above this area in the coming sessions, a recovery scenario could be back on the table at this lower edge.

HNX-Index – MACD Generates a Sell Signal
On June 28, 2024, the HNX-Index witnessed a decline, accompanied by a substantial increase in trading volume compared to the previous session, reflecting the negative sentiment among investors.
Furthermore, the MACD indicator has issued a sell signal following the emergence of a bearish divergence, suggesting continued pessimism in the short term.
At present, the index is testing the SMA 50-day and SMA 100-day moving averages. Should the situation fail to improve in the upcoming sessions, the Fibonacci Retracement 50% level (corresponding to the 225-233 point range) and the lower edge of the long-term Bullish Price Channel are expected to provide strong support for the HNX-Index.

Money Flow Analysis
Fluctuations in Smart Money Flow: The Negative Volume Index for the VN-Index has crossed above the EMA 20-day, reducing the risk of a sudden thrust down.

Foreign Capital Flow Fluctuations: Foreign investors continued to offload holdings on June 28, 2024. If this trend persists in the coming sessions, the outlook will turn more pessimistic.
Vietstock Consulting Technical Analysis Department


