VIETNAM STOCK MARKET REVIEW: WEEK OF 08-12/07/2024
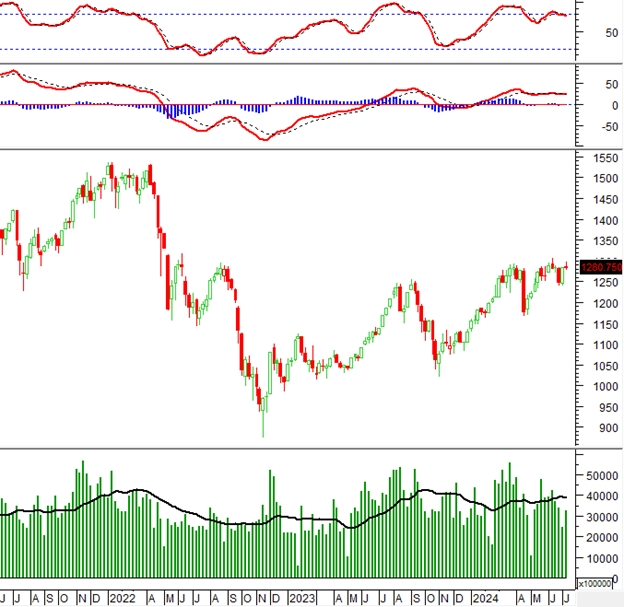
During the week of July 8-12, 2024, the VN-Index witnessed a decline, failing to sustain the upward momentum from the previous week. Moreover, trading volume remained below the 20-week average, further dampening the index’s recovery prospects.
Currently, the MACD and Stochastic Oscillator indicators continue to trend downward after issuing sell signals, indicating that the short-term outlook remains pessimistic.
TECHNICAL ANALYSIS
Trend and Price Oscillation Analysis
VN-Index – Formation of Three Black Candles Pattern
On July 12, 2024, the VN-Index declined and formed a Three Black Candles pattern, accompanied by continuously decreasing trading volume falling below the 20-day average in recent sessions. This reflects the cautious sentiment among investors.
Additionally, the MACD indicator is narrowing its gap with the signal line. If a sell signal reappears, the short-term outlook could turn more negative.
At present, the index is undergoing a correction after testing the upper edge (corresponding to the 1,294-1,307 point region) of the Ascending Triangle pattern. Should this corrective phase persist, the group of SMA 50 and SMA 100 day moving averages, along with the Fibonacci Projection 38.2% level (approximately 1,265-1,280 points), are expected to provide strong support for the VN-Index in the near term.

HNX-Index – High Wave Candle Pattern Emerges
On July 12, 2024, the HNX-Index experienced a tug-of-war session and formed a High Wave Candle pattern, while trading volume remained below the 20-session average, indicating investors’ cautious attitude.
Meanwhile, the index remains above the Middle Bollinger Band, and the Stochastic Oscillator continues to climb higher after issuing a buy signal, suggesting a relatively optimistic short-term outlook.
Presently, the HNX-Index is retesting the upper edge (around 246-250 points) of the Ascending Triangle pattern. If the recovery trend persists, accompanied by improved liquidity, a potential breakout above this level could propel the index towards the 277-281 point region as a mid-term price target.

Money Flow Analysis
Smart Money Flow Variation: The Negative Volume Index for the VN-Index has crossed below the EMA 20 day, indicating an increased likelihood of a sudden downward thrust.

Foreign Capital Flow Variation: Foreign investors resumed net selling on July 12, 2024. A continuation of this trend in the upcoming sessions could lead to a more pessimistic scenario.
Technical Analysis Department, Vietstock Consulting
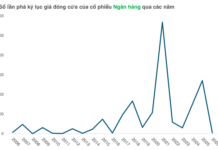
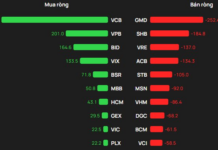
Bank stocks sold off heavily
Today (2/2), the VN-Index continues to rise, but in a cautious trading atmosphere. It is noteworthy that most banking stocks in the VN30 basket are facing strong selling pressure.


