Technical Signals for VN-Index
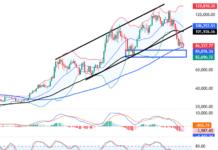
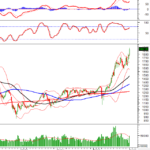
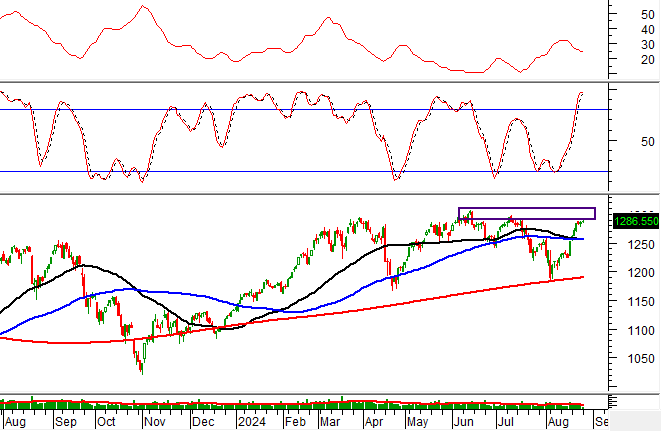
During the morning trading session of August 26, 2024, the VN-Index witnessed a slight increase, forming a Doji candlestick pattern. This was accompanied by a mild rise in trading volume, indicating investors’ cautious sentiment.
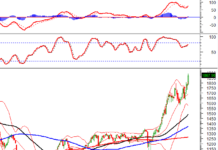
Currently, the VN-Index is advancing towards retesting the June 2024 high (equivalent to the 1,290-1,310 point region). Meanwhile, the ADX indicator is traversing within the gray zone (20<>25), suggesting a high likelihood of continued market divergence in upcoming sessions.
Technical Signals for HNX-Index
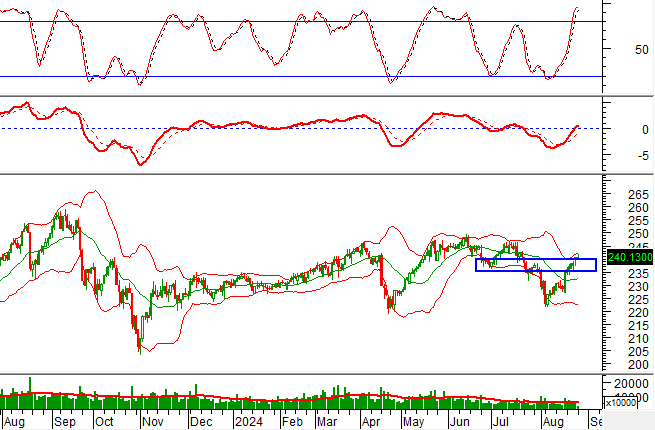
On August 26, 2024, the HNX-Index climbed while forming a Shooting Star candlestick pattern, accompanied by a slight uptick in trading volume. This indicates investors’ uncertainty.
Additionally, the HNX-Index is retesting the June 2024 low (approximately 235-240 points). Meanwhile, the Stochastic Oscillator indicator continues its upward trajectory, delving deeper into the overbought zone. Should a sell signal emerge, and the index fails to surpass this resistance level, the risk of a downward adjustment in subsequent sessions heightens.
PVD – PetroVietnam Drilling and Well Services Corporation
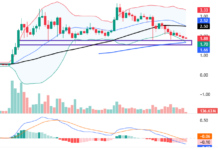
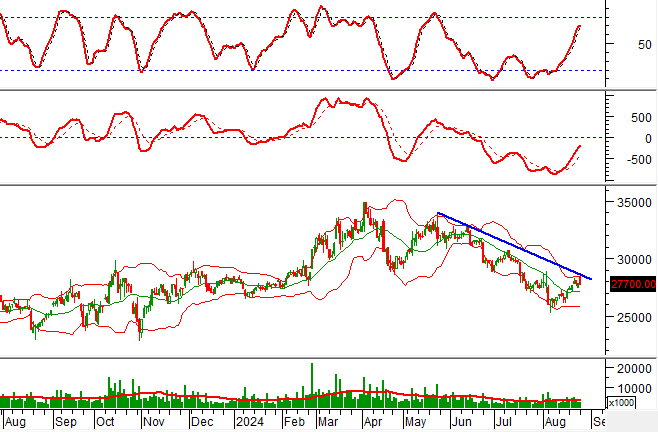
On the morning of August 26, 2024, PVD witnessed a slight decline, coupled with a substantial surge in trading volume, expected to surpass the 20-day average by the session’s end. This reflects investors’ cautious stance.
Furthermore, the stock price is retesting the short-term downward trendline. Meanwhile, the MACD indicator maintains its upward trajectory, having previously generated a buy signal. Should the buy signal persist, and the stock price breaks out successfully, a short-term recovery scenario is plausible in the upcoming sessions.
VPB – Vietnam Prosperity Joint-Stock Commercial Bank
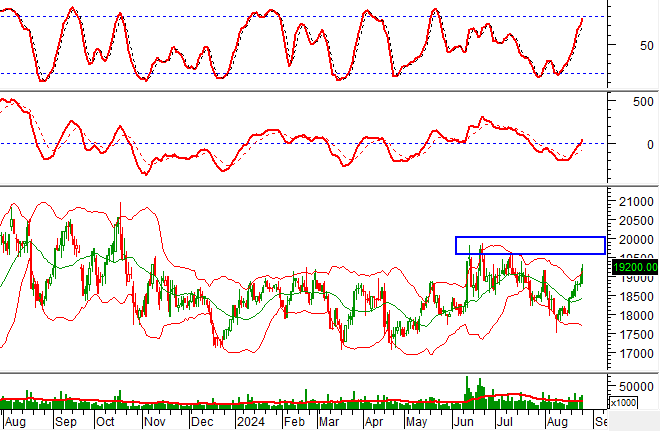
During the morning session of August 26, 2024, VPB witnessed an upward price movement, accompanied by trading volume surpassing the 20-session average, indicating active participation from investors.
Additionally, the stock price surged after crossing above the Middle line of the Bollinger Bands. This upward momentum is further reinforced by the Stochastic Oscillator indicator, which continues its ascent after generating a previous buy signal.
Technical Analysis Team, Vietstock Consulting


