


: Foreign Investors, Safety Ratios, and Credit Ratings")


Technical Signals for VN-Index
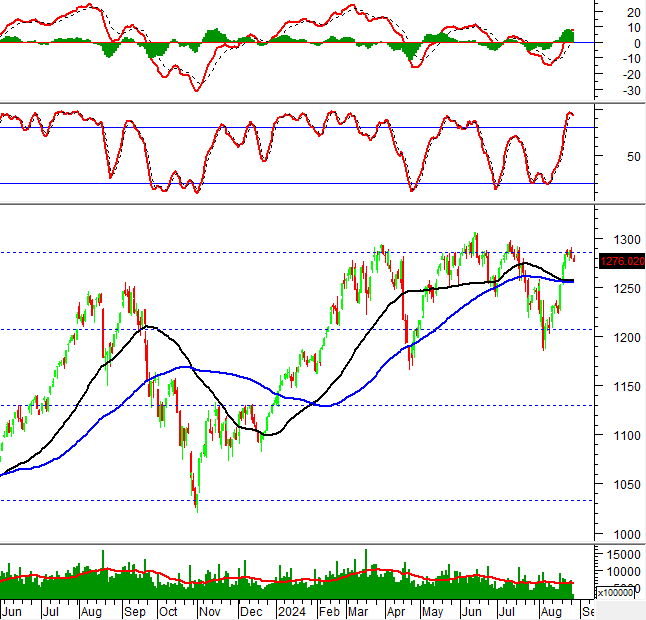
In the trading session on the morning of August 27, 2024, the VN-Index declined with higher trading volume compared to the previous session, indicating investors’ cautious sentiment.
Currently, the VN-Index is retesting the Fibonacci Retracement 61.8% level (corresponding to the 1,275-1,295 point region) while the Stochastic Oscillator has given a sell signal within the overbought territory. Hence, there is a possibility of short-term downside if the indicator falls below this region in the upcoming sessions.
Additionally, the index has successfully surpassed and remains above the 50-day SMA and 100-day SMA, which should act as a strong support zone in case of any corrective scenario in the near term.
Technical Signals for HNX-Index
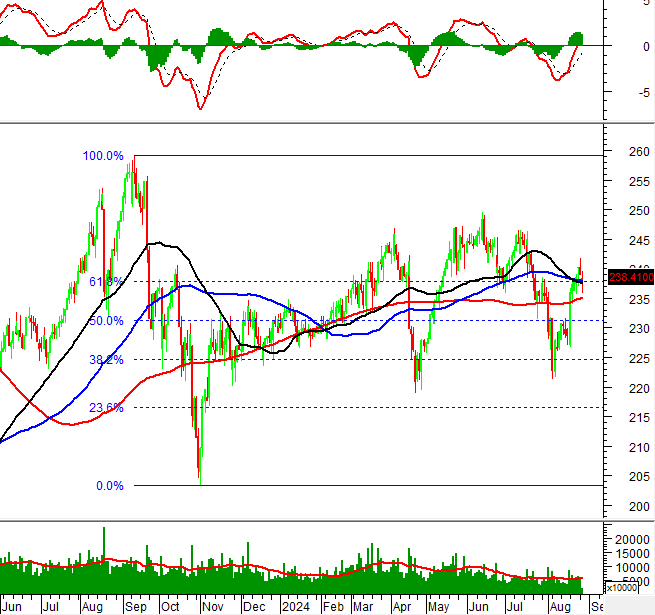
During the trading session on August 27, 2024, the HNX-Index witnessed a slight decline and formed a High Wave Candle pattern, while the trading volume in the morning session decreased compared to the previous session, indicating investors’ cautious sentiment.
Meanwhile, the index is retesting the 50-day SMA and 100-day SMA after a successful breakthrough. This level also coincides with the Fibonacci Retracement 61.8% (around 236-239 points), and the MACD is narrowing the gap with the Signal line. If the situation does not improve, the risk of a downward adjustment will increase in the coming sessions.
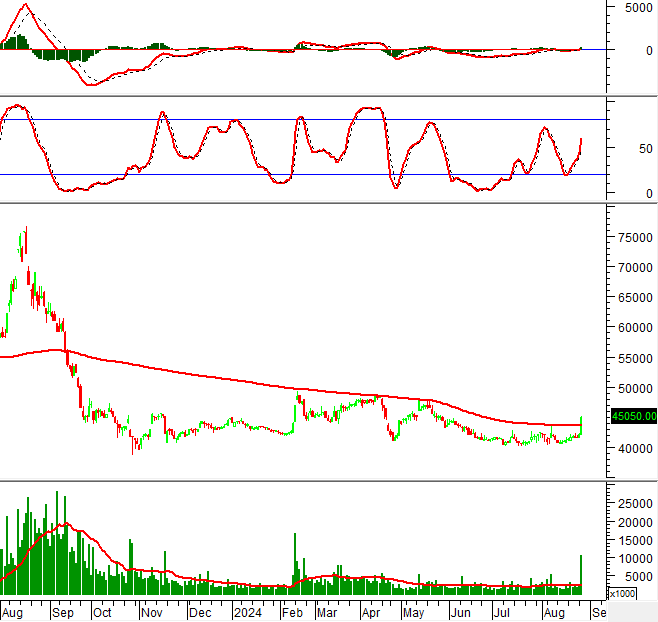
AAA – An Phat Plastic Joint Stock Company
In the morning session of August 27, 2024, AAA witnessed a price increase and formed a Doji candlestick pattern, while trading volume decreased and dried up, indicating investors’ caution.
Moreover, the stock price of AAA is still trading below the 200-day SMA, suggesting that the mid-to-long-term outlook remains uncertain.
However, the Stochastic Oscillator is forming a bullish divergence within the oversold region. This indicates that if a buy signal appears in the upcoming sessions, the prospects for a short-term recovery will return.
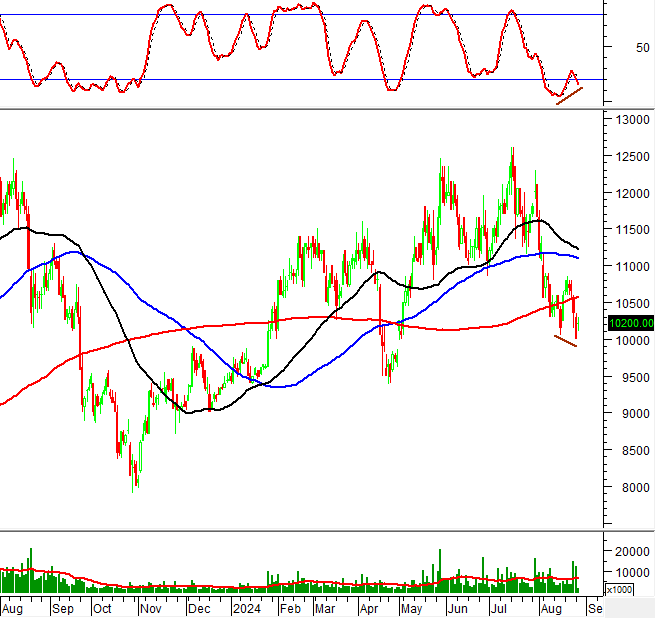
VIC – Vingroup Joint Stock Company
On the morning of August 27, 2024, VIC witnessed a strong price increase and formed a White Marubozu candlestick pattern, while trading volume broke out and surpassed the 20-session average, indicating active participation from investors.
Furthermore, the MACD and Stochastic Oscillator continue to trend upward, providing additional buy signals that reinforce the ongoing recovery momentum.
Technical Analysis Team, Vietstock Consulting
Investing in a volatile market: Should beginners consider putting money into high-yield bonds for 10-30% yearly profit?

Short-term stock market trading has proven to be a risky venture for many investors, leading to substantial losses. However, there are a few select open funds that have managed to achieve impressive returns, reaching up to 30%.
Bank stocks sold off heavily

Today (2/2), the VN-Index continues to rise, but in a cautious trading atmosphere. It is noteworthy that most banking stocks in the VN30 basket are facing strong selling pressure.


