


I. MARKET ANALYSIS OF THE STOCK MARKET BASED ON DATA FROM FEBRUARY 3rd, 2025
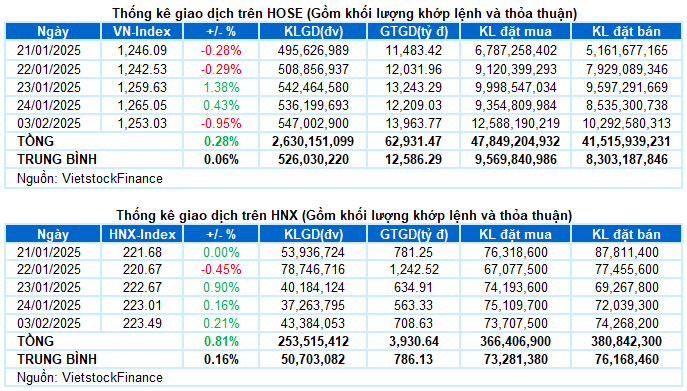
– The main indices showed mixed performance during the first trading session of the Year of the Snake. The VN-Index closed 0.95% lower at 1,253.03 points, while the HNX-Index increased by 0.21% to reach 223.49 points.
– Trading volume on the HOSE exceeded 505 million units, a 2% increase compared to the previous session. On the HNX exchange, trading volume rose by 16.4% to nearly 43 million units.
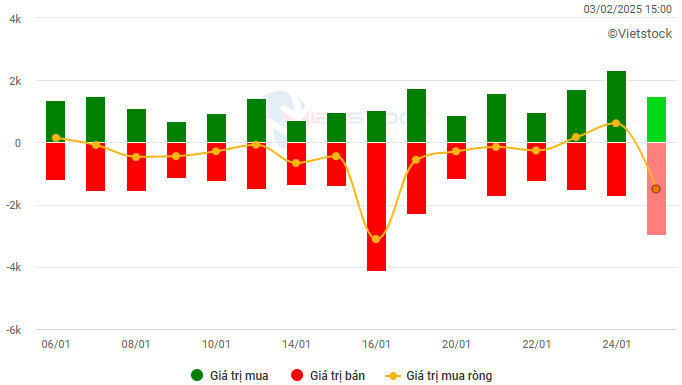
– Foreign investors net sold on the HOSE with a value of nearly VND 1,509 billion and net bought on the HNX with a value of nearly VND 11 billion.
Trading value of foreign investors on HOSE, HNX and UPCOM exchanges by day. Unit: VND billion
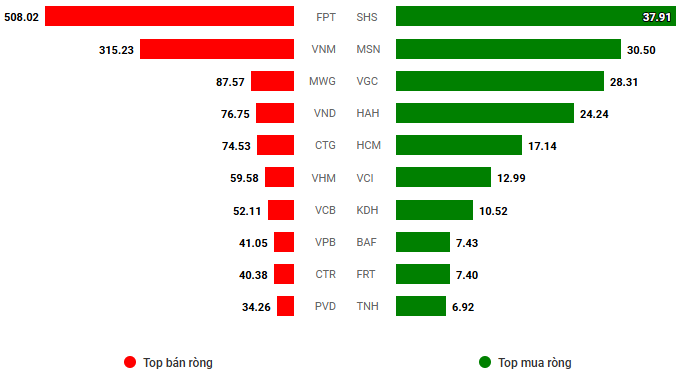
Net trading value by stock code. Unit: VND billion
– Vietnamese securities market started the new year with a bearish session amid a global financial market turmoil triggered by new US trade policies. Strong selling pressure on large-cap stocks appeared from the beginning of the session, pushing the VN-Index down by 10 points just 15 minutes into the trading day. Despite improved liquidity compared to the pre-Tet period, buying demand was overwhelmed by intense selling pressure, especially with significant net selling by foreign investors. At the close on February 3rd, the VN-Index lost 12.02 points (-0.95%) to close at 1,253.03 points.
– In terms of impact, FPT was the most notable stock, taking away 2.7 points from the overall index, leading the negative impact. This was followed by VCB and BID, which also caused the VN-Index to lose more than 2 points. On the other hand, GVR, HVN, and BSR tried to support the index but only managed to lift it by just over 1 point.
– Large-cap stocks were the main driver of today’s sharp decline, with the VN30-Index falling more than 22 points from the previous session to close at 1,315.46 points. The market breadth was heavily skewed towards decliners, with 25 losers, 4 gainers, and 1 stock closing unchanged. Among the decliners, FPT plunged more than 5%, followed by VNM, VIB, VPB, and LPB, which all corrected more than 2%. Conversely, GVR, SHB, and BCM attracted significant buying interest, being the few bright spots in the VN30 group with gains of over 1%.
Most sectors were dominated by red hues. Information technology and telecommunications were the two sectors that witnessed the sharpest declines, losing 4.72% and 3.62%, respectively, in the first trading session of the year. This was mainly due to selling pressure in FPT (-5.15%), CMG (-4.88%); VGI (-2.64%), FOX (-8.64%), and CTR (-5.02%).
The financial sector also exerted considerable pressure on the overall market due to its large capitalization, with many “blue-chip” stocks representative of the sector falling more than 1%, including VCB, BID, TCB, VPB, MBB, LPB, HDB, STB, VIB, TPB, and OCB. A few stocks that went against the overall trend were SHB (+1.46%), BVB (+8%), NVB (+1.12%), and ABB (+2.82%).
On the other hand, the sectors that managed to stay in positive territory today included energy, industrials, discretionary consumer goods, and materials. Notable performers within these sectors were BSR (+1.97%), HAH (+3.42%), VCG (+2.03%), HHV (+2.04%), HVN (+2.79%), BCG (+2.58%), GEX (+3.96%), GEE (+6.92%), GVR (+1.56%), NKG (+2.26%), and DCM (+1.34%), among others.
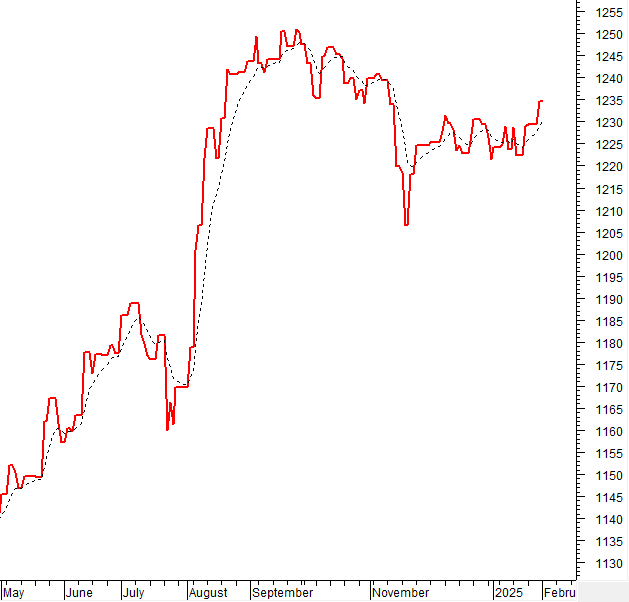
The VN-Index paused its upward momentum with a sharp decline, breaking below the SMA 200-day moving average. If, in the coming sessions, the index falls below the Middle line of the Bollinger Bands, the situation could turn even more negative. However, the Stochastic Oscillator indicator is still maintaining a buy signal, and the MACD is also giving a similar signal, even suggesting the potential to cross above the zero line. If this happens, the risk of a short-term correction will be reduced.
II. TREND AND PRICE MOVEMENT ANALYSIS
VN-Index – MACD Indicator Likely to Cross Above Zero Line
The VN-Index paused its upward momentum with a sharp decline, breaking below the SMA 200-day moving average. If, in the coming sessions, the index falls below the Middle line of the Bollinger Bands, the situation could become more negative.
However, the Stochastic Oscillator indicator remains in the buy zone, and the MACD is also giving a similar signal, even suggesting the potential to cross above the zero line. Should this occur, it would reduce the risk of a short-term correction.

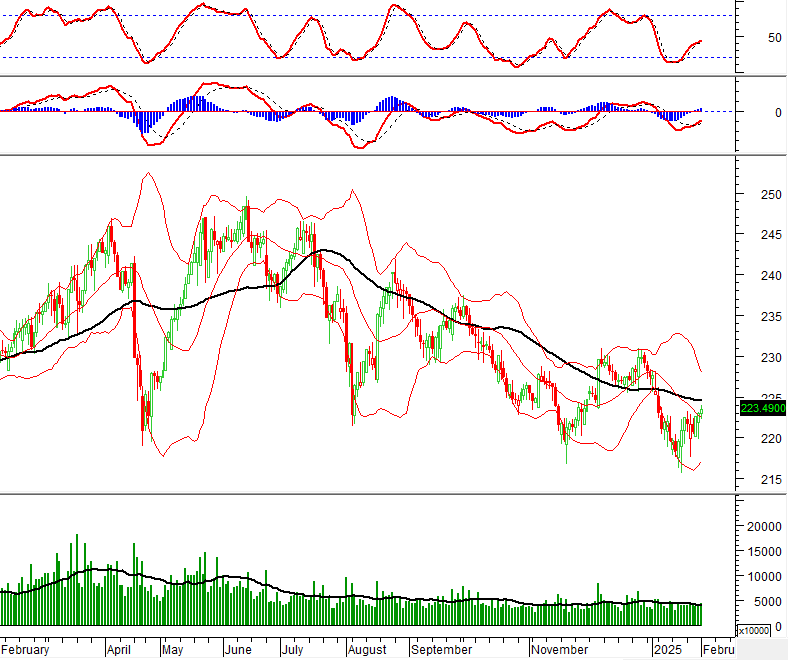
HNX-Index – Sustaining Above the Middle Line of Bollinger Bands
The HNX-Index continued its upward trajectory since crossing above the Middle line of the Bollinger Bands. Additionally, trading volume surpassed the 20-day average, indicating a return of liquidity to the market.
At present, both the Stochastic Oscillator and MACD indicators are maintaining buy signals. Should this status quo be maintained, the short-term optimistic outlook is likely to persist.
Analysis of Capital Flows
Movement of Smart Money: The Negative Volume Index indicator for the VN-Index crossed above the EMA 20-day line. If this trend continues into the next session, the risk of a sudden downturn (thrust down) will be mitigated.
Foreign Capital Flows: Foreign investors resumed net selling during the trading session on February 3rd, 2025. If foreign investors maintain this stance in the coming sessions, the situation could become more pessimistic.
III. MARKET STATISTICS FOR FEBRUARY 3rd, 2025
Analysis by Vietstock’s Economics & Market Strategy Department, Advisory Board
– 17:22 03/02/2025
The Power of Positive Thinking

The VN-Index surged after a period of consolidation around the 200-day SMA. Accompanied by a solid trading volume above the 20-day average, this indicates a positive shift in market sentiment. The Stochastic Oscillator and MACD are both generating buy signals, with the latter crossing above zero, suggesting a further boost to the already optimistic short-term outlook.
The Ultimate Trader’s Journal: Aiming for the December 2024 Peak

The VN-Index extended its upward momentum from the previous session, with trading volume surpassing the 20-day average. A more robust participation of funds in the upcoming sessions could propel the index towards its old peak of December 2024 (1,270-1,280 points). The Stochastic Oscillator and MACD indicators remain bullish, suggesting continued optimism in the short term.
Market Beat: Afternoon Recovery Efforts See VN-Index Gain Almost 2 Points

The market rallied strongly in the first half of the morning session, with green dominating the screens. However, the momentum stalled, and a correction set in, allowing red to creep in. By the end of the session, despite a significant 461 gainers, including 51 stocks hitting the ceiling, there were also 304 decliners, of which 4 touched the floor.
Market Beat: Foreigners Sell-Off, VN-Index Struggles in the First Trading Session of the Year of the Black Tiger

The market closed with the VN-Index down 12.02 points (-0.95%) to 1,253.03, while the HNX-Index climbed 0.48 points (+0.22%) to 223.49. The market breadth tilted in favor of gainers with 380 advancing stocks against 343 declining ones. Meanwhile, the large-cap VN30-Index painted a red picture, with 25 stocks declining, 4 advancing, and 1 stock closing flat.
“Vietstock Weekly: Sustaining the Uptrend”

The VN-Index extended its upward momentum, surpassing the 50-week SMA. However, trading volume remained below the 20-week average, indicating investors’ cautious sentiment. In the upcoming sessions, the index needs to firmly hold above this threshold with improved liquidity to sustain the upward trajectory.


