


: Returning to Critical Support Levels?")


In Q3, banks continued to proactively strengthen their risk absorption capacity. However, provisioning costs increased only marginally, indicating that the pressure to bolster reserves was not significant. This also reflects the banks’ prioritization of resources toward other growth objectives rather than expanding provisions.
The Q3/2025 financial report provides a clearer picture of the non-performing loan coverage ratio (LLR) in the banking system, with positive signals emerging after the sector navigated its most challenging period related to loan portfolio quality. The formation of non-performing loans has significantly slowed, easing pressure on reserves. Amid robust credit growth, banks continue to allocate resources to expand lending, with provisioning costs rising cyclically but without the aggressive provisioning seen in previous stressful periods.
The overall landscape also reveals a growing divergence among bank groups. State-owned banks are focusing on rebuilding their buffers, reflecting a defensive strategy after a period of rapid non-performing loan growth. In contrast, retail banks and smaller institutions have seen improvements in their non-performing loan coverage ratios due to tighter control over the generation of bad debts and maintaining moderate provisioning.
Meanwhile, wholesale banks have temporarily reduced their coverage ratios due to faster growth in non-performing loans. Overall, banks maintain steady provisioning, prioritizing enhanced governance and debt management to reduce reserve burdens. This reflects the dominant strategy in Q3: rather than significantly increasing provisions, banks aim to maintain a balanced buffer—sufficient to ensure systemic safety without compromising profit growth targets for the year.
Assessment of Non-Performing Loans and Coverage in the Banking Sector
In Q3/2025, the industry-wide non-performing loan coverage ratio (LLR) reached 83.93%, up from 82.54% in the same period last year. More importantly, compared to the first two quarters, this ratio has significantly improved, rising from 79.32% in Q2.
To understand the fluctuations in the LLR, it’s essential to analyze its two main components: the provisions set aside during the period and the dynamics of non-performing loan volumes. Regarding bad debts, total non-performing loans among listed banks increased by 8.1% year-on-year—a notable slowdown compared to 2022-2024. Conversely, bad debt provisions reached approximately 230 trillion VND, up 9.9% year-on-year and 11.3% since the beginning of the year. This represents a significant increase compared to the average growth rate of 8% from 2023 onwards.
To bolster reserves, the banking sector set aside an additional 35.5 trillion VND in provisions during Q3 alone. Notably, general provisions surged by 14.85% compared to the end of 2024 (equivalent to 20.7% YoY), while specific provisions rose by approximately 8.64% (equivalent to 2.8% YoY).
Unlike the 2021-2022 period, when high non-performing loan coverage ratios were primarily driven by increases in specific provisions (reflecting deteriorating asset quality), the current provisioning increase is defensive and aimed at strengthening buffers rather than addressing new credit quality issues. This indicates that banks are proactively preparing for a rapid credit cycle and potential risks that may arise during the peak year-end period.
|
Trends in Industry-Wide Non-Performing Loan Coverage Ratio
|
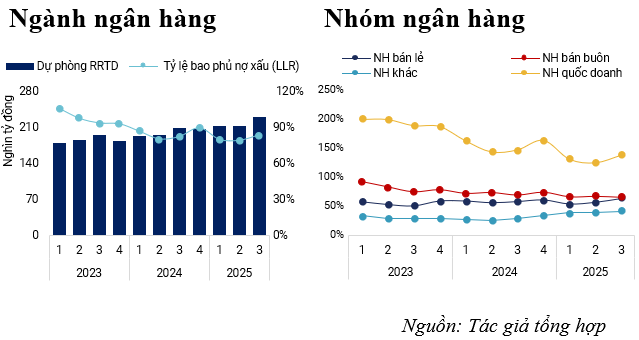
For non-performing loan coverage, state-owned banks maintain the highest LLR in the system. In Q3, their coverage ratio reached 139.1%, significantly lower than 164.5% in 2024 and 188.46% in 2023, due to the impact of rapidly increasing non-performing loans in previous quarters. However, on a quarterly basis, their buffers are rebounding, rising from 132% in Q1 and 126% in Q2 to nearly 140% in Q3. This recovery stems from more effective non-performing loan management, as the growth rate of bad debts has slowed, while general provisions continue to strengthen, increasing by 16-17% year-on-year.
Among private banks, the trend is relatively positive. Retail banks saw their non-performing loan coverage ratio rise from 61.84% to 64.4%, as bad debts increased by only 8.5% year-on-year—the lowest since early 2022. This signals easing pressure on asset quality for this group.
Other banks achieved a coverage ratio of approximately 41.87%, the highest in three years, reflecting efforts to strengthen provisions after the stressful period of 2023. However, this group remains far from the pre-pandemic average of 65% and needs to further enhance provisions to approach previous safety thresholds.
Conversely, wholesale banks recorded a less favorable trend, with their non-performing loan coverage ratio declining from 69.54% in the same period last year to 65.7%, despite a 50% YoY increase in provisioning costs in Q2 and Q3. The primary reason is the 25% YoY growth in non-performing loans, which outpaced provisioning efforts. This highlights the divergence within the system, as some bank groups enter a buffer recovery phase while wholesale banks need to enhance non-performing loan management effectiveness.
Trends in Non-Performing Loan Coverage by Bank
Q3 trends reveal a clear divergence, with only about half of the banks improving their non-performing loan coverage ratios, while the rest declined compared to the same period last year.
Among state-owned banks, VCB continues to lead the system with a non-performing loan coverage ratio of 201.86%. VCB’s significant increase in provisioning costs during the period (+138.2% YoY) reflects efforts to restructure its reserves after a period of decline to maintain profitability amid a sharp drop in NIM.
BID also saw a sharp decline in its buffer, from 115.73% to 94.53%, primarily due to a more than 45% surge in Group 5 debts since the beginning of the year. This forced BID to accelerate provisioning in recent quarters to offset rising risk pressures.
Conversely, CTG significantly improved its non-performing loan coverage ratio from 153.01% to 176.48%, thanks to a reduction in bad debts compared to the same period last year and the previous quarter. With accumulated provisions and stable bad debt ratios, CTG enhanced its overall buffer, particularly general provisions.
Retail banks witnessed notable improvements in their non-performing loan coverage ratios, narrowing the gap with wholesale banks this year. Notably, STB saw its LLR soar to 93.26% in Q3, up from 75% in the previous quarter, primarily due to significant increases in specific provisions. This occurred as STB’s bad debts continued to rise to 2.75%, higher than the 2.5% in Q2 and the same period last year, with Group 5 debts accounting for nearly 70% of total bad debts, creating pressure to strengthen provisions.
ACB, TPB, and VPB also improved their coverage ratios, recording 84.02%, 61.22%, and 55.05% respectively in Q3. In contrast, VIB saw a nearly 8% decline compared to the same period last year, as provisioning levels remained similar while bad debt volumes increased slightly, thinning the overall buffer.
|
Trends in Non-Performing Loan Coverage by Bank
|
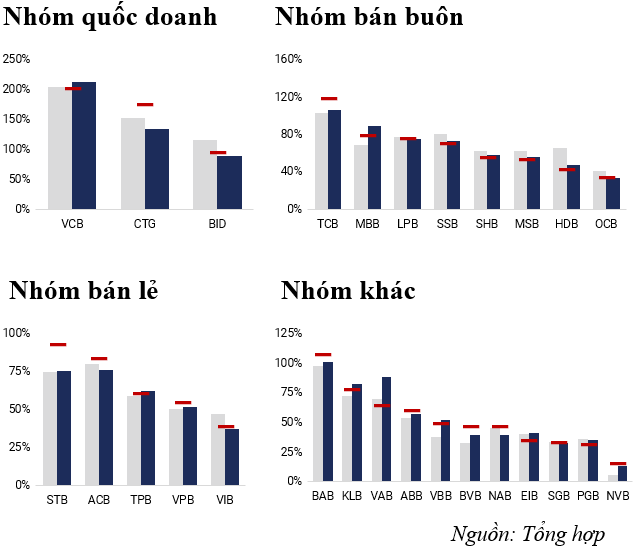
Among wholesale banks, the decline in non-performing loan coverage ratios was widespread, with TCB and MBB being rare exceptions, maintaining relatively strong buffers at 119.24% and 79.21% respectively. In addition to meeting specific provisioning requirements, both banks significantly increased general provisions by over 20% year-on-year, reflecting a more cautious buffer-strengthening strategy.
Conversely, SSB and MSB saw declines of approximately 9% year-on-year, as provisioning costs decreased while total bad debts increased slightly. Most notably, HDB experienced a sharp drop in its non-performing loan coverage ratio from 65.87% to 43.37% in Q3. This significant decline reflects considerable credit risk pressure, as HDB’s cumulative bad debts as of 9/2025 surged by 66%, far outpacing provisioning increases.
Among other banks, BAB remains the standout in terms of buffer quality, maintaining a coverage ratio above 100% at 108.37% in Q3. BAB also has the lowest bad debts in the group, with bad debt volumes increasing by only about 5% since the beginning of the year, while provisions rose by 16.41%, indicating a proactive provisioning strategy.
VBB and BVB also saw notable improvements, reaching 49.95% and 47.17% respectively. Despite modest increases in provisioning costs, both banks expanded their buffers by effectively controlling bad debt growth, thereby reducing provisioning pressures.
Conversely, VAB and EIB saw declines of approximately 5% year-on-year, primarily due to faster bad debt growth in Q3, while provisioning increases were limited, significantly narrowing their coverage ratios.
Overall, the non-performing loan coverage ratios of banks in Q3 show an improving trend, mainly due to a significant slowdown in bad debt growth and many banks consistently supplementing general provisions. However, this improvement is not uniform, as some banks still recorded declining coverage ratios due to less effective bad debt control.
– 07:00 21/11/2025
Savings Rate Race Heats Up: Banks Offer Bonus ‘Extra Interest’ to Attract Depositors

Credit pressure, exchange rates, and liquidity concerns have driven deposit interest rates to surge within the private banking sector. Some institutions are offering rates up to 1.5 times the listed rate, intensifying the year-end capital attraction race.
Empowering Financial Growth: Banks Leading the Nation’s Development Journey

Credit recovery is robust and projected to sustain its strong growth trajectory, driven by substantial capital demand from the retail sector and businesses, as well as the ripple effects of public investment. This momentum is poised to significantly contribute to achieving the ambitious GDP growth target of 8% by 2025.
2025 Q3 Banking Overview: Surging Profits, Credit Growth, Shrinking NIMs, and Intensifying Capital Raising Pressures

The banking sector is entering a robust growth phase, yet it faces significant challenges. While credit is accelerating and profitability is improving, the narrowing net interest margin (NIM) is sharply differentiating the competitive capabilities of individual banks.
Year-End Interest Rates Surge: What It Means for You

Interest rates on deposits are heating up as multiple banks have collectively raised their rates since the beginning of November.
How Record-Breaking Stock Markets Have Fueled Bank Performance

The third quarter of 2025 marks a historic milestone as the VN-Index surpasses its peak, with the banking sector playing an irreplaceable leading role. Interestingly, the vibrant stock market has also delivered a powerful boost to the business operations of banks, particularly those owning securities companies.


