


Technical Signals of the VN-Index
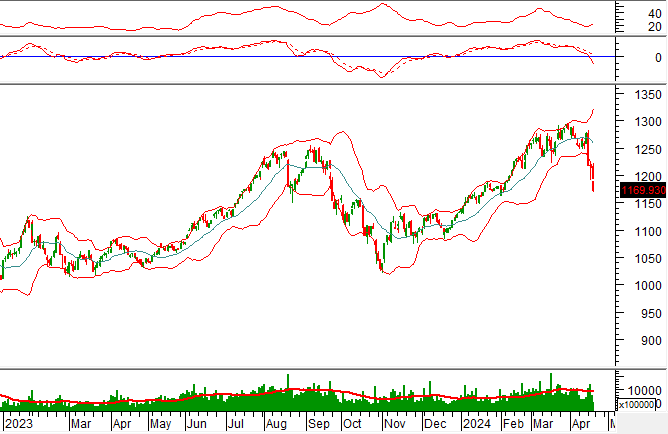
During the morning session on April 19th, 2024, the VN-Index depreciated significantly and displayed a Falling Window candlestick pattern. The increased trading volume during the morning session shows that the sentiment of investors is still quite pessimistic.
In addition, the index is still tracking the lower band of Bollinger Bands. This is while the MACD indicator continues to weaken and remains below 0 after delivering a previous sell signal. Therefore, the short-term outlook is still unlikely to return to a positive state.
Technical Signals of the HNX-Index
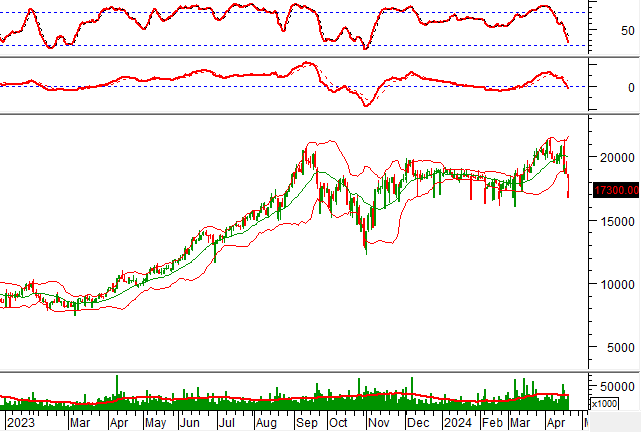
During the trading session of April 19th, 2024, the HNX-Index plunged and exhibited a candle pattern that strongly resembles the Black Marubozu. In addition, the liquidity surged in the morning session. The author anticipates that it will surpass the 20-day average after the session closes. This indicates that investor sentiment is rather negative.
Furthermore, the HNX-Index penetrated below the SMA 200-day line. This occurred while the MACD indicator sustained its descent following an earlier sell signal. This suggests that the outlook is still unable to turn optimistic.

DXG – Dat Xanh Group Joint Stock Company
In the morning session of April 19th, 2024, DXG fell while simultaneously displaying a Falling Window candle pattern. The trading volume increased during the morning session, demonstrating rather pessimistic investor sentiment.
Moreover, the Stochastic Oscillator indicator continues to trend downwards and is currently in the oversold zone. In the upcoming sessions, if a buy signal appears and the indicator surpasses this zone, the outlook will become less pessimistic.

SHS – Saigon – Hanoi Securities Joint Stock Company
During the morning session on April 19th, 2024, SHS sharply declined while displaying a pattern resembling an Inverted Hammer. The trading volume grew significantly, exceeding the 20-day average, indicating that selling pressure remains rather high.
Additionally, the stock is staying close to the lower band of Bollinger Bands. Simultaneously, the MACD indicator keeps on weakening and has crossed below 0 after giving a sell signal. This shows that the short-term outlook is still quite gloomy.
Technical Analysis Department, Vietstock Consulting Room


