

: A Sharp Rise Followed by a Retreat")


")


: A Mixed Bag of Wins and Woes")


Technical Signals for the VN-Index
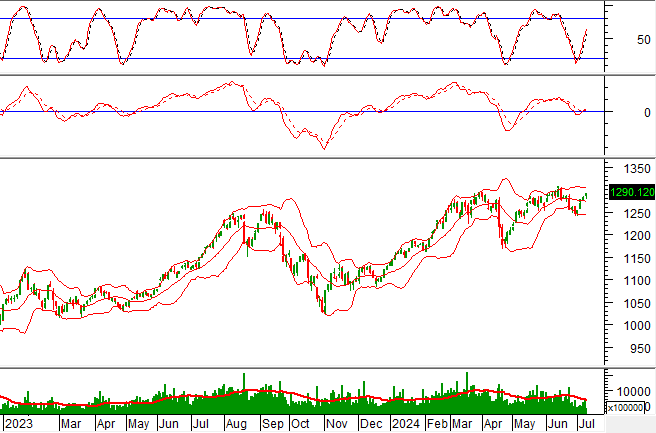
During the trading session on the morning of July 9, 2024, the VN-Index gained points, with a significant increase in trading volume. This indicates a positive sentiment among investors.
At present, the VN-Index is moving sideways after breaking above the Middle Bollinger Band. The MACD indicator continues to rise, having previously given a buy signal, suggesting that the short-term optimistic outlook remains intact.
Technical Signals for the HNX-Index
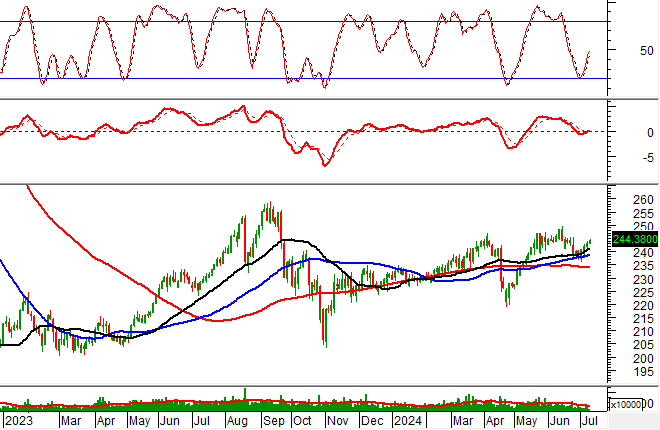
On July 9, 2024, the HNX-Index rose, along with improved trading volume in the morning session, indicating the optimism of investors.
In addition, the HNX-Index is being well supported by the SMA 50-day and SMA 100-day moving averages. The MACD indicator has given a buy signal again, suggesting that the medium-term upward trend of the stock is still being maintained.
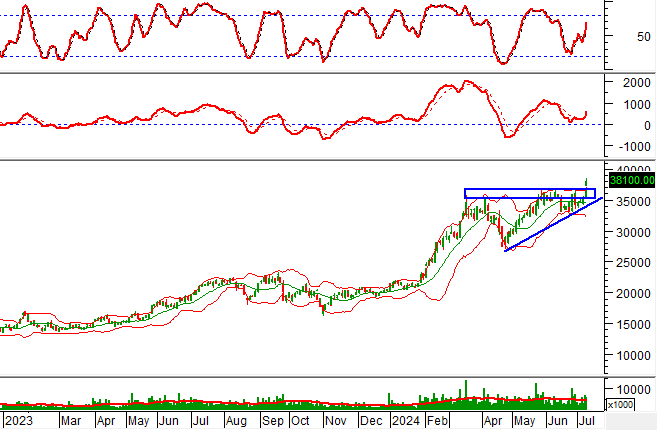
GVR – Vietnam Rubber Group – JSC
On the morning of July 9, 2024, GVR witnessed a strong surge in price, forming a Rising Window candlestick pattern, while liquidity significantly increased in the morning session, surpassing the 20-session average. This indicates active trading among investors.
Furthermore, the stock price rebounded after successfully testing the Middle Bollinger Band. The Stochastic Oscillator indicator continues to rise, having previously given a buy signal, reinforcing the strength of the stock’s current upward trend.
Additionally, the stock price has broken through the upper edge (corresponding to the 35,000-36,8000 region) of the Ascending Triangle pattern. If the upward momentum is maintained, the potential price target that could be achieved in the coming time is the region of 43,800-44,200.
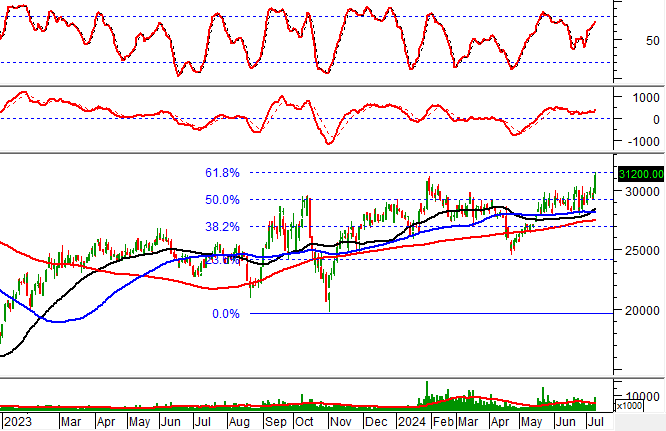
PC1 – PC1 Group JSC
On the morning of July 9, 2024, PC1 witnessed a sharp rise in price, forming a near-identical long-body candlestick pattern, along with improved trading volume in the morning session, surpassing the 20-session average. This indicates the optimism of investors.
Currently, the stock price has rebounded after successfully testing the Fibonacci Projection 50% threshold (corresponding to the 28,900-30,4000 region). The MACD indicator has given a buy signal again, suggesting that the short-term upward trend is likely to continue in the next sessions.
Technical Analysis Department, Vietstock Consulting
Investing in a volatile market: Should beginners consider putting money into high-yield bonds for 10-30% yearly profit?

Short-term stock market trading has proven to be a risky venture for many investors, leading to substantial losses. However, there are a few select open funds that have managed to achieve impressive returns, reaching up to 30%.
Bank stocks sold off heavily

Today (2/2), the VN-Index continues to rise, but in a cautious trading atmosphere. It is noteworthy that most banking stocks in the VN30 basket are facing strong selling pressure.


: A Sharp Rise Followed by a Retreat")


: A Sharp Rise Followed by a Retreat")


