


: Short-Term Correction Signals Emerge")


Technical Signals of VN-Index
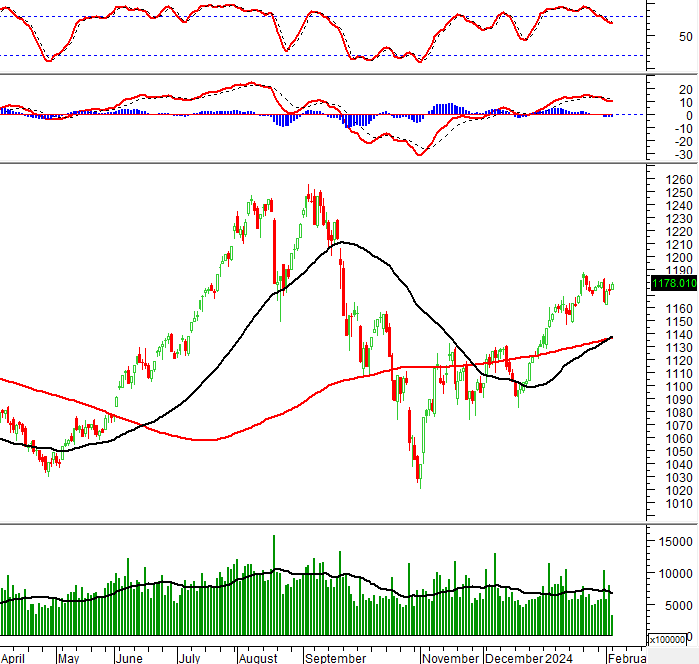
In the morning trading session on February 5, 2024, VN-Index gained points and at the same time, a Golden Cross signal appeared between the 50-day SMA and the 200-day SMA. If this signal is maintained, it will support the growth potential of the index in the future.
However, the trading volume needs to show a clearer improvement and exceed the 20-day average for the upward momentum to be more sustainable.
Technical Signals of HNX-Index
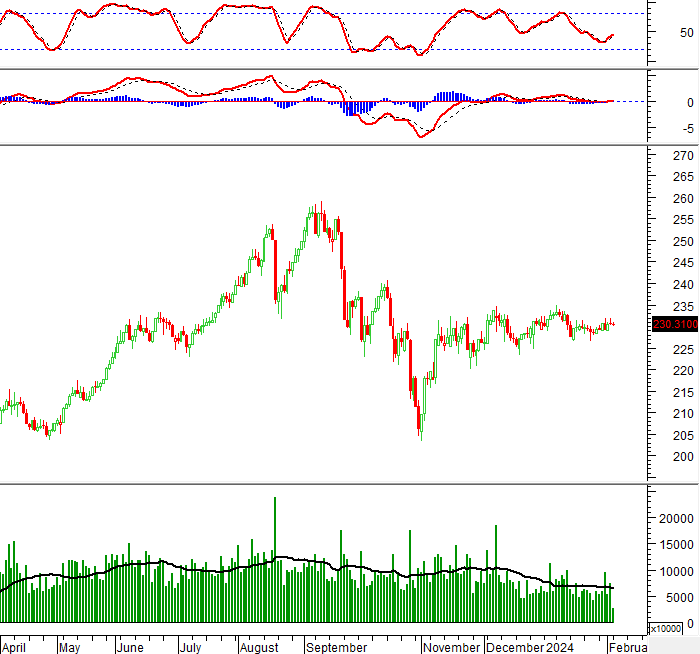
In the trading session on February 5, 2024, HNX-Index decreased points and formed a High Wave Candlestick pattern. This indicates that investors are still undecided.
However, both the Stochastic Oscillator and MACD indicators give positive buying signals, showing a not too pessimistic outlook for the future.
FPT – FPT Corporation
In the morning trading session on February 2, 2024, FPT stock continued to rise and reached a 52-week high after a Golden Cross signal appeared between the 50-day SMA and the 100-day SMA, demonstrating the optimistic sentiment of investors.
The trading volume showed improvement in the morning session and is expected to exceed the 20-day average at the end of the session.
In addition, the MACD is trending upwards after giving a buy signal, so it is likely that the upward trend will continue.

HAH – Hai An Transport and Stevedoring Joint Stock Company
In the morning session on February 2, 2024, HAH surged strongly and formed a Three White Soldiers candlestick pattern. The continuous improvement in trading volume and a breakthrough above the 20-day average indicate a very positive outlook.
Furthermore, the Stochastic Oscillator has given a buy signal and exited the oversold zone, so it is highly likely that the upward trend will continue to be strengthened.
Currently, the price of HAH stock has surpassed the Fibonacci Retracement 78.6% level and is heading towards the previous peak in October 2023 (equivalent to the range of 41,000-42,200).

Technical Analysis Department, Vietstock Advisory


