


Technical Signal of VN-Index
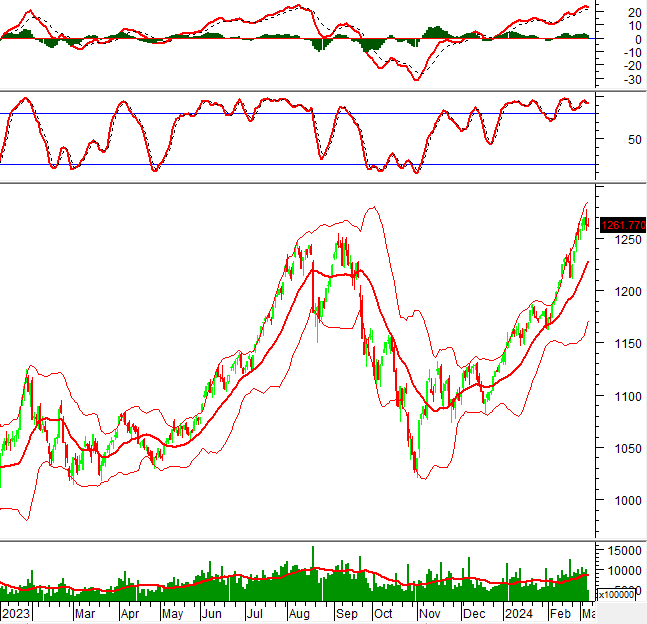
During the morning session on March 7, 2024, VN-Index decreased while experiencing a volatile state with an increased trading volume in the morning session, which demonstrates the investors’ hesitation.
In addition, the gap between the MACD line and Signal line continues to narrow. If there is no improvement and the selling signal reappears, the prospects will be less optimistic.
Technical Signal of HNX-Index
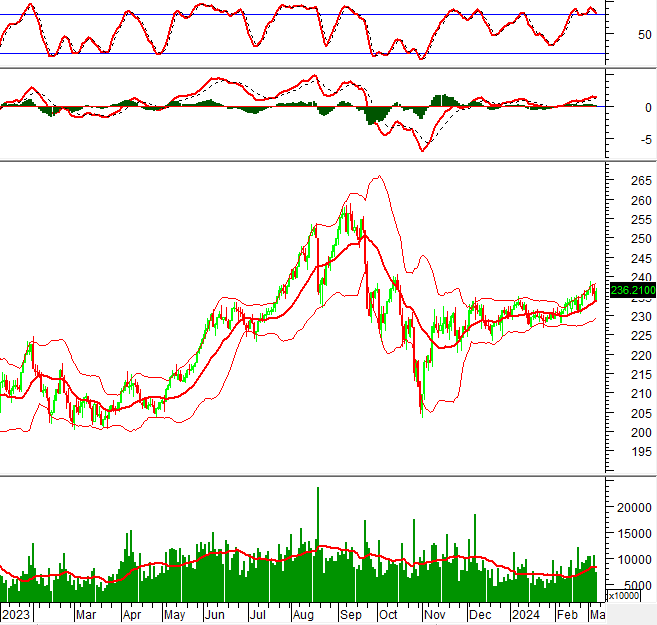
During the trading session on March 7, 2024, HNX-Index rebounded after testing the Middle line of Bollinger Bands, accompanied by an expected trading volume that will exceed the 20-day average, indicating the investors’ relatively positive sentiment.
However, the Stochastic Oscillator has given a selling signal in the overbought zone, so the risk of correction may increase when the indicator falls out of this zone.
BCM – Binh Minh Industrial Investment and Development Joint Stock Company
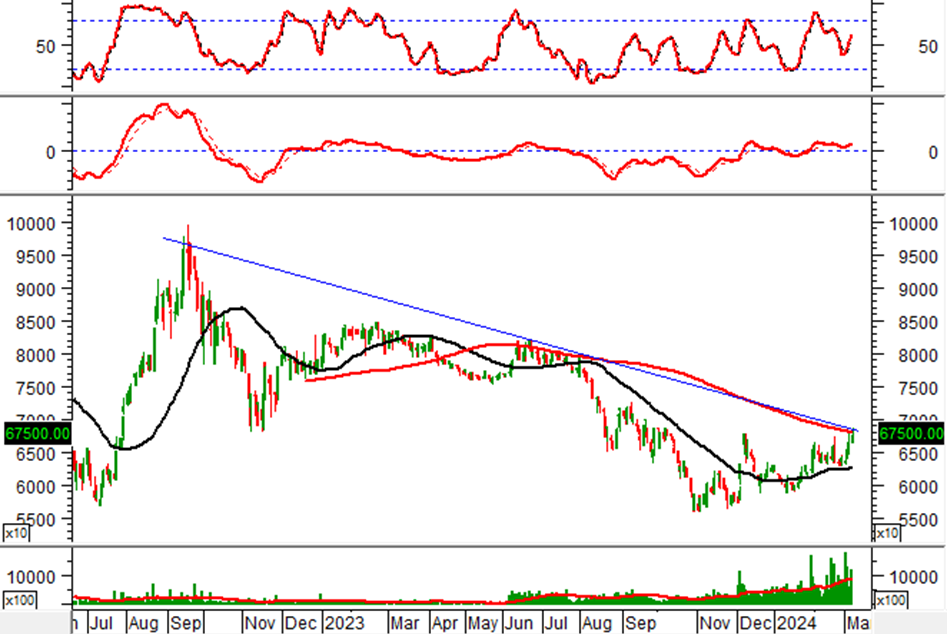
During the morning session on March 7, 2024, BCM stock continued to rise with a trading volume in the morning session exceeding the 20-day average, reflecting the investors’ optimistic sentiment.
In addition, the MACD indicator continues to trend upward after giving a buy signal, indicating a potential recovery.
However, the index has broken the long-term bearish trendline and is testing the 200-day SMA line, while the Stochastic Oscillator is forming a bearish divergence. As this is a long-term resistance, there may be short-term fluctuations in the upcoming sessions.
VCI – Vietcap Securities Joint Stock Company
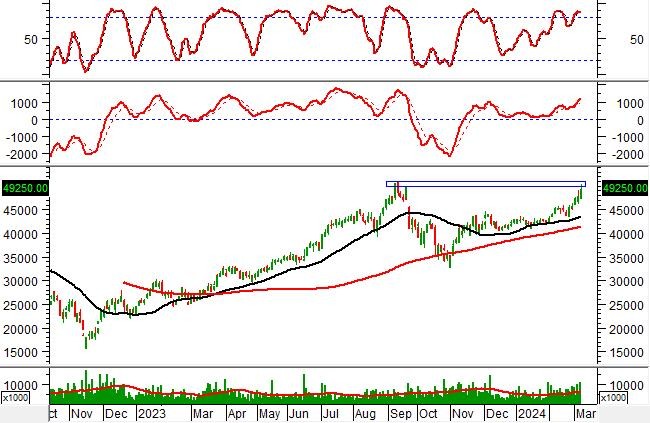
During the morning trading session on March 7, 2024, the price of VCI stock continued to rise sharply with a trading volume in the morning session exceeding the 20-day average, indicating the stock’s attraction to investors.
In addition, the MACD indicator continues to trend upward after giving a buy signal, further consolidating the medium-term uptrend.
However, VCI is testing the previous high in September 2023 (equivalent to the range of 48,700-50,700), while the Stochastic Oscillator has given a selling signal in the overbought zone after a bearish divergence. This indicates that the risk of correction will increase when the indicator falls out of this zone.
Technical Analysis Department, Vietstock Advisory Division


