


BTC: Testing the Neckline of the Rounding Bottom Pattern
In the weekly chart, BTC continues to maintain its medium-term upward trend after the sequential appearance of a Golden Cross between the SMA 50 and SMA 100 with the SMA 200, indicating a positive outlook for this cryptocurrency.
Furthermore, the price of BTC has been consistently making higher highs and higher lows, while staying close to the upper band as the Bollinger Bands continue to expand, suggesting the formation of a new upward cycle for BTC.
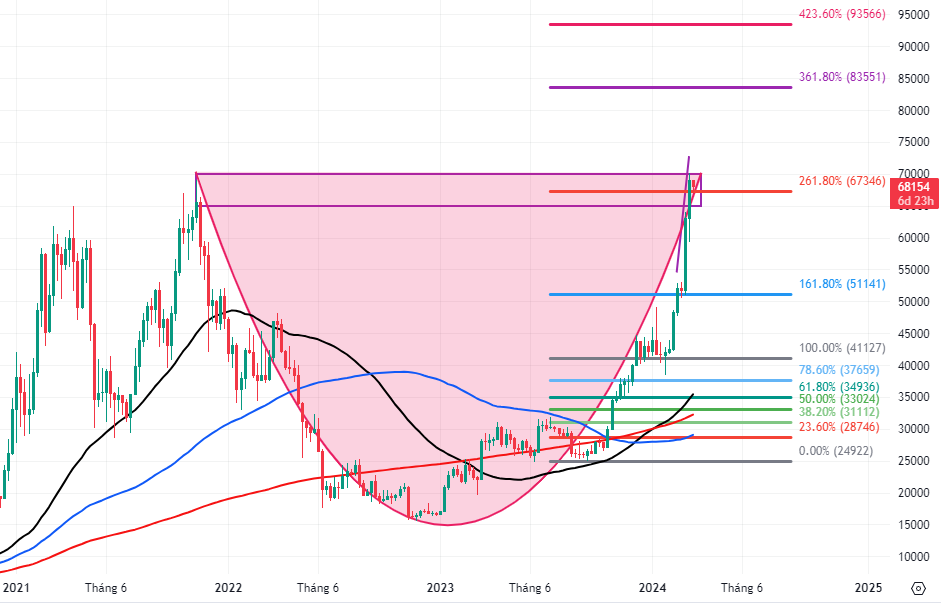
BTC chart from 2021 – 2024 – Source: TradingView
Looking back at the daily chart, the current price of BTC has surpassed the Fibonacci Projection 161.8% target (equivalent to the range of $49,400 – $52,000) as mentioned in the Q4 2023 Crypto Report (Part 1) and the Fibonacci Projection 261.8% level. This range also coincides with the neckline of the Rounding Bottom pattern. If the trend continues to hold in the coming weeks and BTC successfully breaks out of this range, the next potential price target will be the range of $120,000 – $125,000.
However, the Stochastic Oscillator is currently in the overbought zone. This indicates a higher possibility of a short-term correction as the indicator gives a sell signal and falls out of this zone.
In summary, investors may observe and wait for the short-term risk signals to dissipate before optimizing their investment returns.
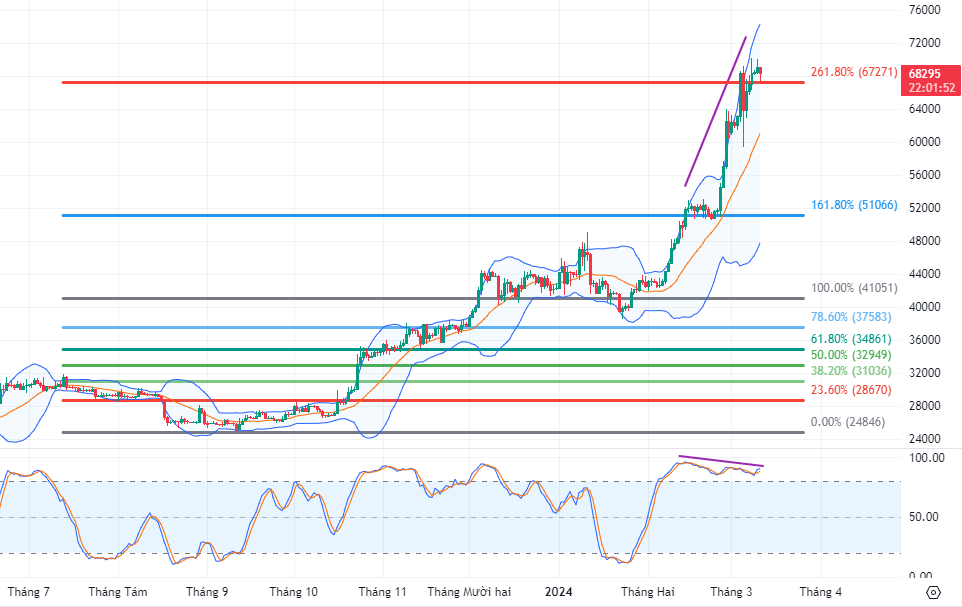
BTC chart from 2023 – 2024 – Source: TradingView
ETH: Breaking Above the Upper Edge of the Bullish Price Channel
Since the beginning of 2024, ETH has seen 6 consecutive weeks of price increases, successfully breaking above the upper edge of the Bullish Price Channel. This is accompanied by MACD continuing to rise after giving a buy signal, indicating that the current upward trend is being further consolidated.
In the weekly chart, ETH has successfully surpassed the previous high in March 2022 (equivalent to the range of $3,200 – $3,600) while the ADX continues to rise above the level of 30. This indicates that the upward trend has formed and this range will serve as strong support in the near future, allowing investors to consider buying at this range when short-term corrections occur.
Finally, the author expects the upward trend of ETH to continue in the near future as long as the aforementioned signals are maintained. The potential price target in the near term could be in the range of $4,200 – $4,600 before reaching the long-term price target of the Rounding Bottom pattern at the range of $13,100 – $14,700.
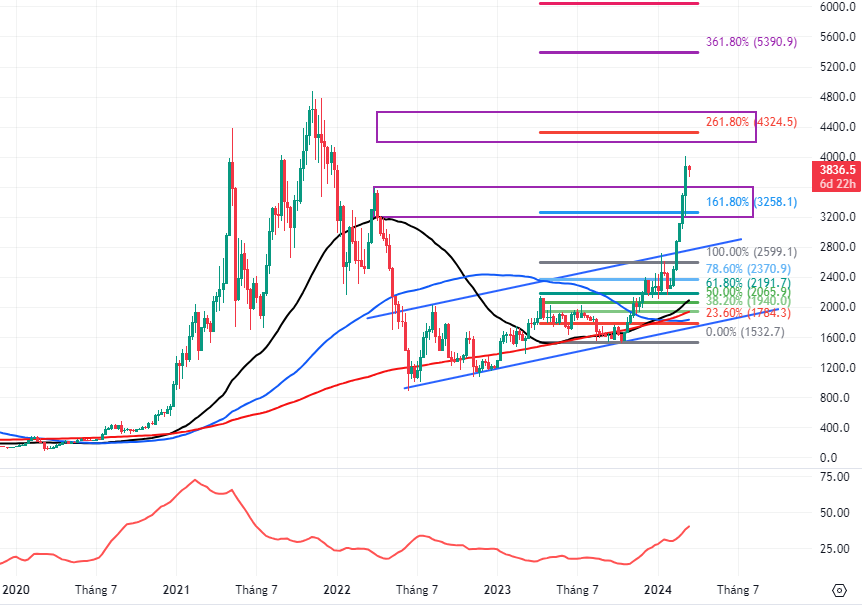
ETH chart from 2022 – 2023 – Source: TradingView
Technical Analysis Department, Vietstock Advisory Department


