


MARKET UPDATE WEEK 26/02-01/03/2024
During the week of 26/02-01/03/2024, the VN-Index rose strongly and maintained its positive momentum for 4 consecutive weeks. In addition, the index formed a pattern similar to a White Marubozu candlestick in the past week, indicating the investors’ bullish sentiment.
However, the Stochastic Oscillator indicator has moved deep into the overbought zone, increasing the risk of a sell signal reappearing.

TECHNICAL ANALYSIS
Trend and Price Fluctuation Analysis
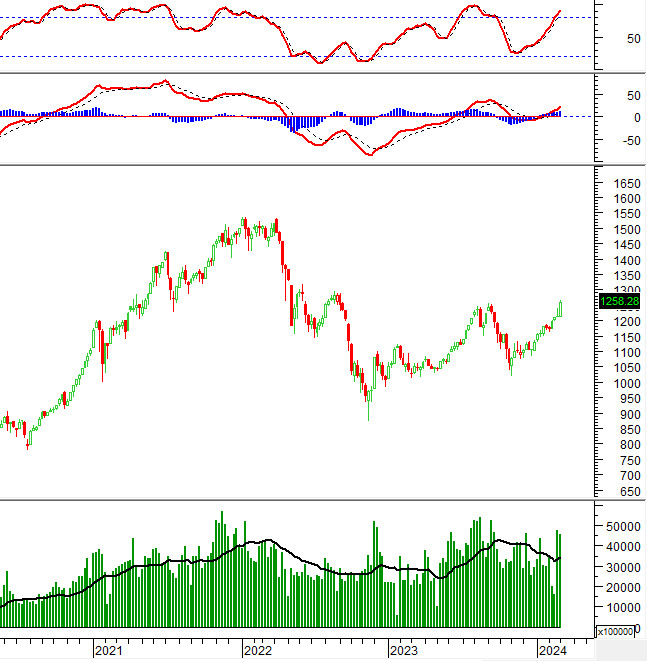
VN-Index – Formation of bearish divergence
In the trading session on 01/03/2024, the VN-Index increased while forming a candlestick pattern similar to a Hammer, accompanied by volume continuing to stay above the 20-day moving average, indicating active trading by investors.
However, the Stochastic Oscillator is forming a bearish divergence in the overbought zone. The risk of a correction will increase if a sell signal reappears and the indicator falls out of this zone in future sessions.
Currently, the VN-Index is testing the 161.8% Fibonacci Projection level (equivalent to the range of 1,246-1,266 points). If it successfully breaks through this level in the near future, it could serve as a strong support zone for the VN-Index in its current long-term uptrend.

HNX-Index – Successful breakout of the upper edge of the Ascending Triangle pattern
In the trading session on 01/03/2024, the HNX-Index increased with increasing volume and surpassed the 20-day moving average, indicating an optimistic sentiment among investors.
Furthermore, the MACD indicator remains above 0 and is upward sloping, indicating a positive outlook for the HNX-Index.
Currently, the index has successfully broken out of the upper edge (equivalent to the range of 232-235 points) of the Ascending Triangle pattern. If the upward momentum is maintained, the price target in the near future could be the range of 248-251 points.

Money Flow Analysis
Smart money flow volatility: The Negative Volume Index of the VN-Index has crossed above and is above the 20-day EMA. Therefore, the risk of a sudden thrust down will decrease.

Technical Analysis Department, Vietstock Advisory Department


