


Technical signals of VN-Index
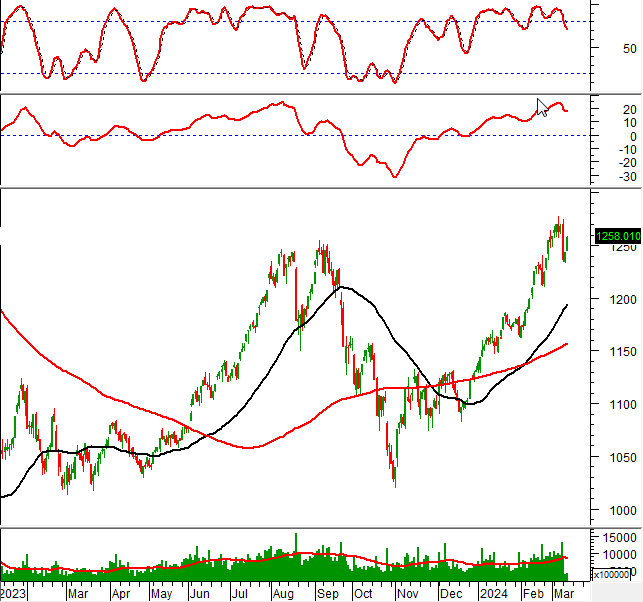
In the morning trading session on March 13, 2024, VN-Index continued to increase slightly in points, but the trading volume in the morning session still showed no clear improvement, indicating the investors’ hesitancy.
However, the Stochastic Oscillator and MACD indicators are still pointing downwards and giving sell signals, indicating existing risks.
Currently, the Middle line of the Bollinger Bands is still acting as a short-term support level for the index.
Technical signals of HNX-Index
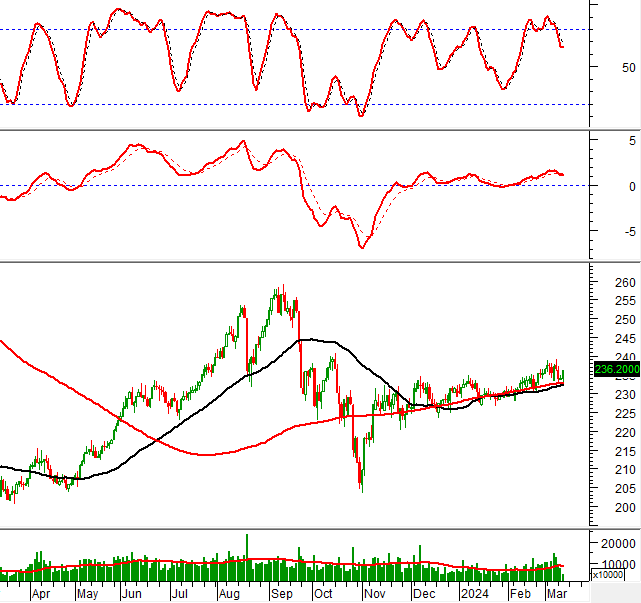
In the trading session on March 13, 2024, HNX-Index rebounded with an improved trading volume in the morning session, indicating a positive sentiment among investors.
However, the Stochastic Oscillator has given a sell signal after falling out of the overbought zone. Therefore, the positive outlook has yet to return in the short term.
CTD – Coteccons Construction Joint Stock Company
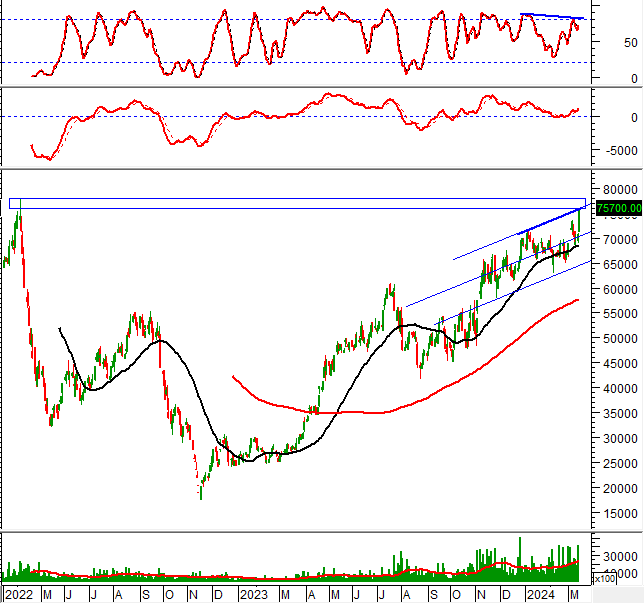
In the morning session of March 13, 2024, the stock CTD formed a White Marubozu candlestick pattern with a significant increase in trading volume, reflecting the optimistic sentiment of investors.
In addition, the MACD indicator continues to trend upwards after giving a buy signal, indicating a positive outlook in the long term.
However, the stock price is currently testing the previous high of April 2022 (equivalent to the range of 75,000 – 77,000) and the upper line of the Bullish Price Channel.
The Stochastic Oscillator is giving a bearish divergence signal, indicating a risk of correction in the short term.
GIL – Binh Thanh Production Trading and Import-Export Joint Stock Company
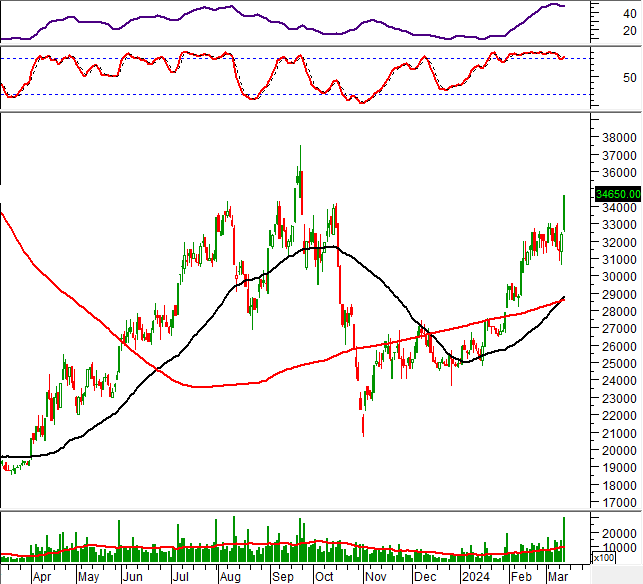
In the morning session of March 13, 2024, the stock GIL hit the limit up price and formed a Rising Window candlestick pattern with trading volume exceeding the 20-day average, indicating active trading activity among investors.
A golden cross appeared between the 50-day SMA and the 200-day SMA, while the ADX indicator is trending upwards and maintaining above 40, further consolidating the positive long-term outlook.
Technical Analysis Department, Vietstock Advisory


