


Technical signals of VN-Index
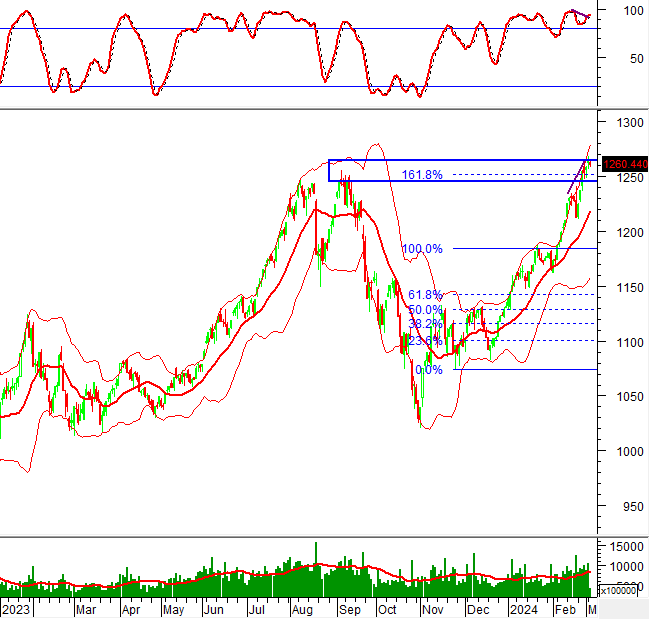
In the morning trading session on 05/03/2024, VN-Index declined accompanied by a decrease in volume, indicating cautious investor sentiment.
In addition, the Stochastic Oscillator indicator is forming a bearish divergence in the overbought zone, suggesting a potential downside correction if sell signals appear in the coming sessions.
However, VN-Index is currently testing the neckline (equivalent to the 1,245-1,265 range) of the Rounding Bottom pattern. If the index successfully breaks above this range, the long-term price target is the 1,500-1,520 range.
Technical signals of HNX-Index
In the trading session on 05/03/2024, HNX-Index had a volatile movement and formed a candle pattern similar to a High Wave Candle, accompanied by a significant decrease in volume, indicating lackluster trading activity.
Currently, the Stochastic Oscillator has given a sell signal in the overbought zone. If the indicator falls below this zone, the risk will increase.
DGC – Duong Hac Chemical Group Joint Stock Company
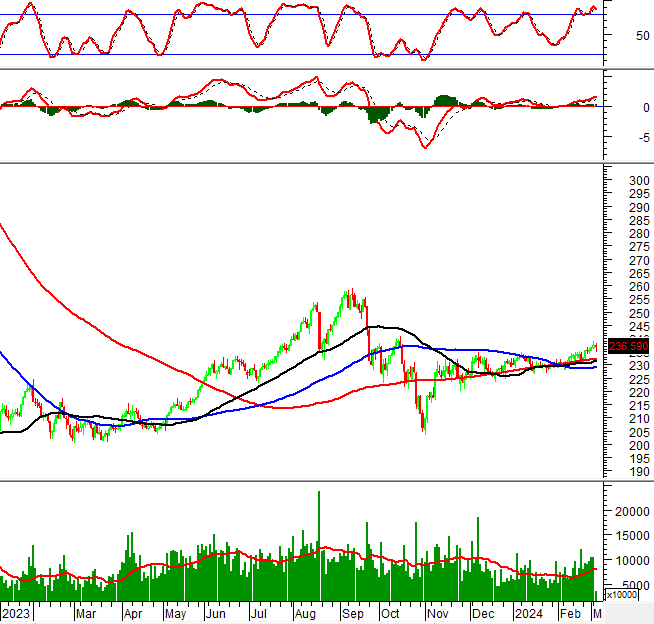
In the morning trading session on 05/03/2024, the stock price of DGC continued to rise and closely followed the upper band of the Bollinger Bands, with the ADX above 40 indicating a strong upward trend.
In addition, the MACD indicator continues to rise above 0 after giving a buy signal, further confirming the current uptrend.
The stock price of DGC has successfully broken above the upper edge (equivalent to the 96,400-99,200 range) of the Ascending Triangle pattern, with a potential price target of the 130,700-133,500 range.
IJC – Infrastructure Development Technical Joint Stock Company
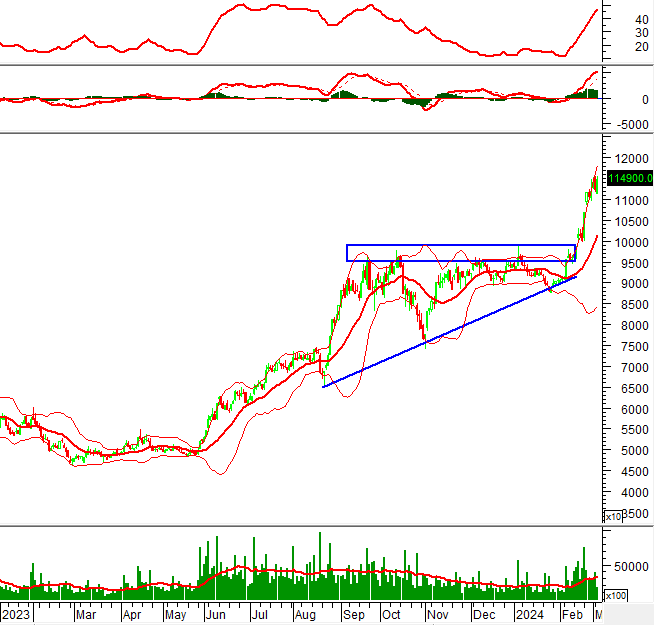
In the morning session on 05/03/2024, the stock price of IJC continued to rise after the Golden Cross between the 50-day SMA and the 100-day SMA, accompanied by the 200-day SMA, along with volume surpassing the 20-day average, indicating maintained optimism.
In addition, the MACD indicator continues to rise after giving a buy signal, indicating a high probability of the upward trend continuing.
However, the price of IJC has successfully broken above a long-term downtrend trendline and is currently retesting the old peak of August-September 2023 range (equivalent to the 15,000-15,600 range), with the Stochastic Oscillator in the overbought zone. Short-term risk could emerge at the current price level if the indicator gives a sell signal and falls below this zone in the coming sessions.

Technical Analysis Department, Vietstock Advisory Department


