


.")


Technical Signals of VN-Index
In the morning trading session on March 15, 2024, VN-Index dropped points with fluctuating trading volume, reflecting the unstable psychology of investors in recent sessions.
In addition, the MACD indicator continues to trend downwards after giving a sell signal, indicating that the risk of adjustment still exists.

Technical Signals of HNX-Index
In the trading session on March 15, 2024, HNX-Index slightly decreased points and formed a Gravestone Doji candlestick pattern, indicating continued selling pressure.
The trading volume decreased compared to the previous session, reflecting the cautious sentiment of investors.
Currently, the index is moving within a Bullish Price Channel, accompanied by the ADX indicator remaining below the level of 20 since November 2023. This suggests that there is a high possibility for HNX-Index to continue sideways and upward movement in the coming sessions.

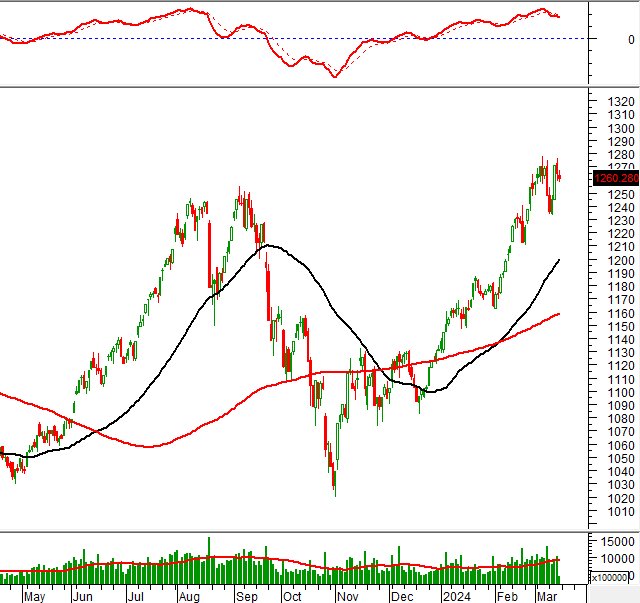
HDC – Bà Rịa – Vũng Tàu House Development Joint Stock Company
In the morning session on March 15, 2024, HDC stock formed a Rising Window candlestick pattern, accompanied by a sudden increase in trading volume, indicating a positive sentiment of investors.
The stock price surged and surpassed the long-term resistance zone of the 200-day SMA (Simple Moving Average), as well as successfully broke the medium-term downtrend Trendline since July 2023 (equivalent to the range of 32,000-33,000), suggesting a high possibility of the recovery trend coming back.
In addition, the MACD indicator continues to trend upwards and surpasses the 0 threshold after giving a buy signal, further consolidating the bullish momentum.

TLG – Thien Long Group Joint Stock Company
In the morning trading session on March 15, 2024, the stock price of TLG increased sharply and continued to stay above the 100-day SMA, accompanied by trading volume in the morning session surpassing the 20-day average, indicating an optimistic sentiment of investors.
The stock price maintains the recovery momentum after breaking out of the Bearish Price Channel, while the MACD and Stockchartic Oscillator continuously create higher highs and higher lows, suggesting a positive outlook.
In a positive scenario, the stock price continues to approach the next target price level at the Fibonacci Retracement 61.8% (equivalent to the range of 53,000-54,000).

Technical Analysis Department, Vietstock Advisory Division


