


.")


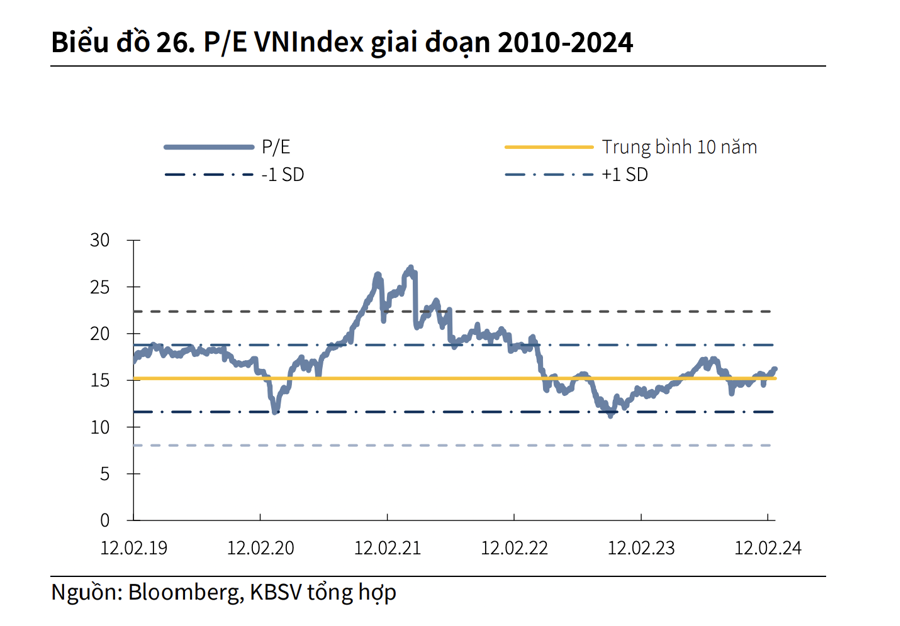
According to KBSV, the current P/E ratio of the VN-Index is around 16.2x – this P/E ratio has excluded any extraordinary profits of companies, so it differs from the calculations of other organizations.
This valuation level is approaching the high range of the average of the past 2 years, but not much higher than the 10-year average of the VN-Index. Based on the expectation of an economic recovery throughout 2024 and the maintenance of low interest rates, the market valuation is still appropriate for investors to accumulate stocks for medium- to long-term goals, but opportunities with attractive profit margins will gradually decrease as many stocks approach high valuation levels.
Regarding the market fluctuations in March, KBSV believes that the VN-Index will continue to fluctuate at high levels with a sustained recovery trend, but it is not expected to experience a strong breakout like in the first 2 months of the year, and short-term adjustment risks are increasing.
Regarding the domestic situation, low interest rates and expectations of business performance recovery in 2024 will drive the stock market. In particular, some sectors such as Industrial Real Estate have shown positive signals from the newly announced FDI data for the first 2 months of the year, with the number of projects increasing by 55% and large-scale projects.
In addition, the profitability of the export sector is expected to improve as the import-export data of Vietnam for the first 2 months of the year show some positive signs. It is also noted that March is the time when the business performance picture becomes clearer, and the market may react before the Q1 financial reports are released.
KBSV maintains the view that business performance will differentiate across sectors, and stock prices will have a similar reactive pattern.
Investor sentiment is still supported when looking at other markets around the world. In the US, the main indices are still performing positively at historically high levels. Market attention will focus on the Federal Reserve’s meeting at the end of March. According to the CME FedWatch Tool, the market currently predicts a 3% probability of a rate cut in March and a 77.6% probability in May. In Asian markets, indices in China, South Korea, and other countries are also showing signs of recovery.
From a technical perspective, on the daily chart, VNIndex is still maintaining a short-term upward trend with higher highs/lows compared to the previous ones. The trading volume is forming a new trading value level of over 20 trillion per session, helping to strengthen the trend and have quite convincing recovery sessions after technical corrections.
In addition, the ADX indicator – the average directional index, has sharply risen from the 24 zone since the beginning of February to around 41 at the end of the month, indicating the strength of the trend and the possibility of continuing upward momentum in the short term.
However, on the weekly and monthly time frames, the risk factors are more clearly demonstrated as the index approaches the notable resistance zone corresponding to the previous short-term rebound high in August 2022. At the same time, the ADX indicator in both time frames is below the 25 level during the recovery phase from the October 2023 bottom.
Therefore, there is a high probability that the VN-Index will face significant volatility pressure in the 1300-1350 resistance zone, which is also a notable level to confirm whether the market has returned to an upward trend in the medium term.
The trading volume will be an important clue to monitor in the breakout movements after the index approaches the resistance level. If the index continues to rise with higher highs but the trading volume decreases, it will be a signal leaning towards (70% probability) a strong correction phase with support around 1220 (+-10) and deeper support at 1170 (+-10).
The remaining scenario (30% probability) is that the VN-Index may maintain its upward momentum through the 1300-1350 range, but the probability for this scenario is not high as many leading sectors have had medium-term breakouts and technical indicators all indicate overbought signals.


