


.")


The chart patterns are reinforcing the upward trend.
The inverted head and shoulders pattern is forming. After bottoming in October-November 2023, the market quickly recovered, while the pattern formation of the inverted head and shoulders pattern with the neckline passing through the peaks of October-November 2023. This pattern was confirmed on the session of December 4, 2023.
However, the VN-Index had 2 consecutive sessions closing below the neckline (on December 18-19, 2023). Normally, a correction below the neckline implies a failed pattern. However, in this situation, the possibility of the pattern still dominating is quite high because (1) When correcting below the neckline, there was no increase in volume, which implies a false crossover signal. While in the breakout session (pattern confirmation), the volume increased. (2) The end of December usually coincides with the holiday season in Western and American markets, and the Vietnamese market is preparing for the Western New Year and the Lunar New Year. Investors tend to “lose focus” on the market, so some noise signals are normal.
Therefore, the possibility of the inverted head and shoulders pattern still dominating the market despite the appearance of 2 noise sessions. The price target of this pattern is still the previous peak in August-September 2023 in the 1,240-1,260 point range.
|
Figure 1. Inverted head and shoulders and rectangle patterns
|
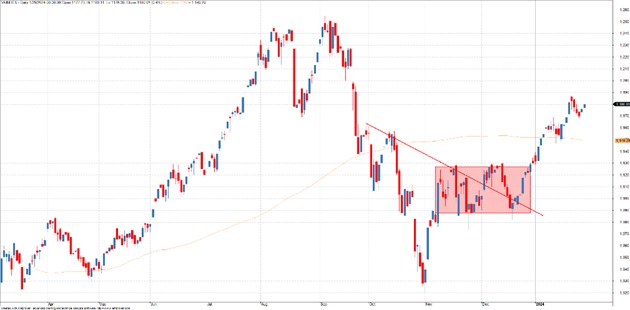
The rectangle pattern. From November 2023 to December 2023, the VN-Index formed a rectangle pattern with the upper limit at 1,130 points and the lower limit at 1,080 points (Figure 1). This pattern was confirmed on the trading session of January 3, 2024, when the index surpassed the 1,130 point level with a price target of 1,180 points. Currently, VNIndex has reached the price target of this pattern.
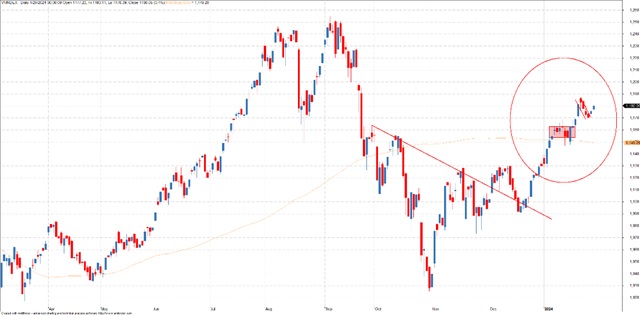
Accumulation period in January 2024. At the beginning of January 2024, the index formed a small rectangle accumulation phase (see Figure 2). This can be seen as a horizontal flag pattern. This pattern was confirmed on January 18, 2024. This is a continuous trend pattern, so the price target will be calculated by the length of the flagpole or the 1,240 point range.
Flag pattern. The flag pattern appeared in the second half of January 2024 (see Figure 2). This pattern was confirmed on the session of January 26, 2024. This is also a continuous trend pattern, so the price target will be calculated by the flagpole or the 1,210 point range.
Multiple continuous trend patterns appearing imply the consolidation of the market’s recovery. This is a positive signal for the market’s growth potential in the short and medium term. The current price target with these pattern groups is the previous peak in August-September 2023.
|
Figure 2. Trend consolidation period and flag pattern
|
Growth cycles
8th 3-year cycle. In September 2023, the index surpassed the moving average of 375 periods, an indicator used to determine peaks and bottoms in the 3-year cycle. This implies that the November 2022 bottom is the bottom of the 7th 3-year cycle. At this point, the market marked the end of the 7th 3-year cycle and opened the 8th 3-year cycle. The expected bottom of this cycle will form during the period from May 2025 to May 2026. Since the current 8-year cycle is divided into 3 sub-cycles, each sub-cycle of 1 year, the peak of the current 3-year cycle may appear in the second or third sub-cycle, namely from 2024 to 2026. It is highly likely that this peak will appear in the third sub-cycle, i.e., in 2025 to 2026, thanks to improvements in fundamental factors.
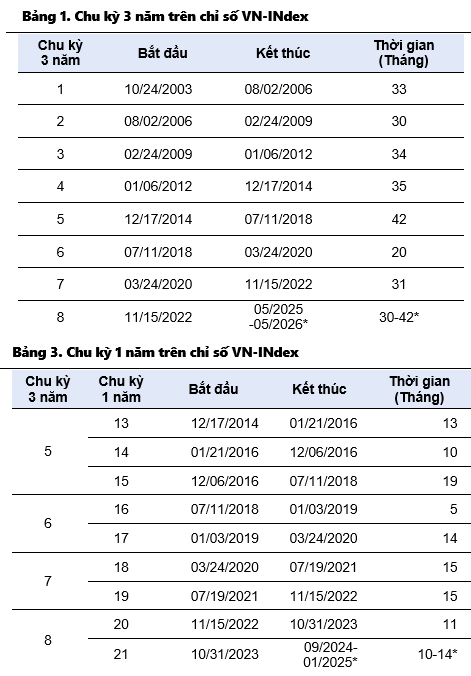
* Estimated bottom time
|
Second sub-cycle of the 3-year cycle. The 8th 3-year cycle is divided into 3 cycles of 1 year each, with each cycle lasting 12 months, with the first 1-year cycle starting from the November 2022 bottom to the October 2023 bottom. From the October 2023 bottom, the market is starting a new growth cycle, and it is currently in the process of forming the second 1-year cycle. The bottom of this cycle is expected to appear between September 2024 and January 2025. Since this is a bullish cycle, the peak will appear in the second half of the cycle, i.e., from May 2024 onwards. The peak of this phase could reach the 1,350-1,450 point range. This implies that the market will continue to grow for at least 4 more months.
Note: Some analysis about cycles has been streamlined so that readers can grasp the key points. If you want to learn more about market analysis and cycles, you can search for previous articles by the author on this topic.
Tran Truong Manh Hieu – Head of Stock Analysis at KIS Vietnam


